겨울철 서울과 대전지역 대기 중 HONO의 생성 및 광분해 특성이 O3 생성에 미치는 영향 규명
Abstract
Nitrous acid (HONO) can produce hydroxyl radical (OH radical) via photolysis during daytime. These OH radicals oxidize volatile organic compounds (VOCs), contributing to the formation of ozone (O3) and secondary aerosols. In order to investigate the characteristics of HONO in the urban air, HONO and related gaseous compounds were measured in Daejeon, Korea during the winter 2022, and Seoul, Korea during the winter 2020. During the entire measurement period, HONO concentrations were measured to be 0.7±0.6 ppbv and 1.7±1.3 ppbv in Daejeon and Seoul, respectively. HONO showed a very good correlation with nitrogen dioxide (NO2) with a R2 of 0.78 in Daejeon whereas it showed good correlations with not only NO2 but also Relative humidity (RH) with R2 of 0.8 and 0.62, respectively in Seoul. These results implied that NO2 is important for the nighttime HONO formation both Daejeon and Seoul during winter while RH is also important in Seoul. It was found that HONO concentrations started to decrease rapidly through photolysis as ultraviolet-A (UV-A) (320~400 nm) intensity increased. The satellite observations showed that high aerosol surface area over the Korean Peninsula during the study period was mainly caused by inflow of the long-range transported haze from the Asian continent. It was found that both high cloud cover and high aerosol surface area decreased UV-A intensity, resulting in less photolysis of HONO. Finally, O3 was not actively produced due to the decreased UV-A intensity and less photolysis of HONO in Daejeon and Seoul during winter.
Keywords:
HONO, O3 formation, Aerosol surface area, UV-A, Long-range transport1. 서 론
대기 중 아질산 (HONO: nitrous acid)은 질소산화물 (NOx)과 반응하여 생성되는 가스상 물질로서 짧은 수명을 가지고 있다 (Gil et al., 2021; Chou et al., 2009; Finlayson-Pitts and Pitts, 2000). HONO의 생성기작은 주로 낮 시간 일산화질소 (NO: nitric oxide)와 하이드록실 라디칼 (OH radical: hydroxyl radical)의 동질반응 (homogeneous reaction)에 의한 반응식 (1)과 밤시간 이산화질소 (NO2: nitrogen dioxide)와 H2O의 이질반응 (heterogeneous reaction)에 의한 반응식 (2)로 나눌 수 있다 (Gil et al., 2020; Zhang et al., 2019a; Goodman et al., 1999). 도심지역의 경우 건물, 도로, 대기 중 에어로졸 등 다양한 표면이 존재하기 때문에 heterogeneous reaction으로부터 발생하는 HONO를 파악하는 데 어려움이 있다.
| (1) |
| (2) |
이외에도 HONO는 가정난방 및 차량 등 화석연료 연소에서 직접 배출되기도 한다 (Klosterköther et al., 2021; Kramer et al., 2020; Peng et al., 2020; Theys et al., 2020; Liu et al., 2017; Kurtenbach et al., 2001). Zhang et al. (2023)에 따르면 중국 교외지역에서는 배출원에서 직접 배출되는 HONO가 대기 중 HONO 농도에 최대 39~45%까지 기여한다는 연구 결과가 보고되었다. 최근 연구에서는 HONO가 토양으로부터 배출되는 것이 확인되었고, 극지방과 같이 오염원에서 떨어져 있는 지역에서는 HNO3와 질산염 광분해로부터 생성되는 것이 보고되었다 (Wang et al., 2021; Wu et al., 2019; Ye et al., 2017, 2016; Weber et al., 2015; Oswald et al., 2013; Su et al., 2011; Zhou et al., 2011; Zhou et al., 2003, 2002; Reisinger, 2000).
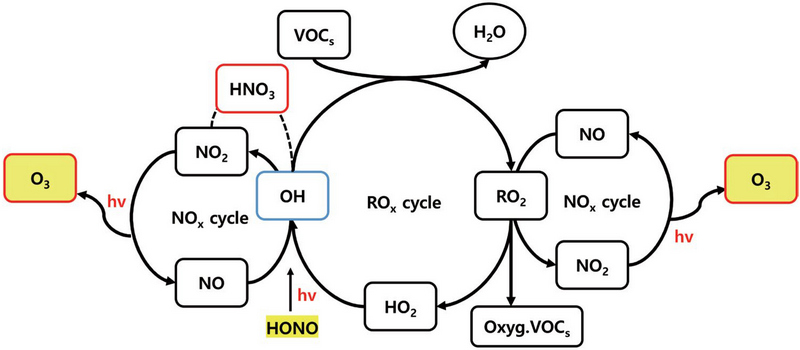
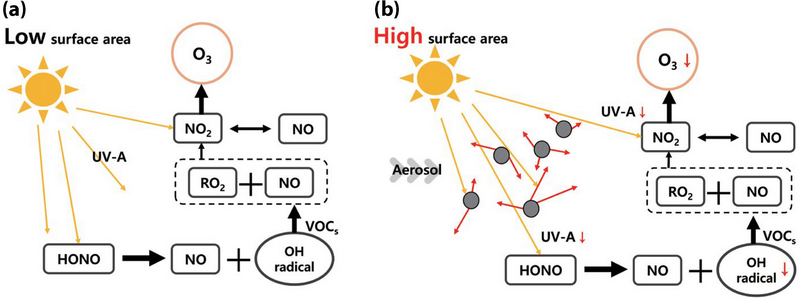
생성된 HONO는 낮 시간 320~400 nm 파장의 ultraviolet-A (UV-A)에 의해 NO와 OH radical로 분해된다 (Pagsberg et al., 1997). 낮 시간 광분해에 의해 생성되는 OH radical은 하루 평균 OH radical에 최대 30%까지 기여하는 것으로 보고되었다 (Ryan et al., 2018). OH radical은 대기 중 휘발성 유기화합물 (vol-atile organic compounds: VOCs)과 반응하여 2차 오염물질을 생성한다 (Gligorovski et al., 2015). 그림 1에 보이는 바와 같이 OH radical은 VOCs를 산화시켜 peroxy radical (RO2)를 생성한다 (Hu et al., 2023). RO2는 NO와 반응하여 oxygenated volatile organic compounds (OVOCs)를 생성하여 secondary organic aerosol (SOA)에 생성에 영향을 주거나, NOx cycle를 통해 O3 생성에 기여한다 (Hu et al., 2023; Zhang et al., 2019b; Alicke et al., 2003).
특히 Gil et al. (2021)에 따르면 2016년 5~6월 서울지역은 O3이 고농도 사례일 때 HONO 광분해로 인해 생성된 OH radical이 비 사례일보다 약 50% 높은 것으로 보고되며 이는 도심지역의 고농도 O3 분포를 이해하기 위해 HONO의 생성 및 광분해 특성에 대한 연구가 필요함을 시사한다. 또한 최근 연구에서는 HONO 광분해로 인해 생성된 OH radical이 NO2와 반응하여 HNO3 생성에 영향을 줄 수 있음이 보고 되어 O3뿐만 아니라 초미세먼지에 대한 전반적인 이해를 위해 HONO 연구의 중요성이 강조되고 있다 (Andersen et al., 2023; Lim et al., 2022).
다수의 선행 연구에서 HONO 광분해에 의한 OH radical 생성률을 구하기 위해 HONO 광분해율 (pho-tolysis rate)을 사용하였다 (Wolfe et al., 2016; Saunders et al., 2003; Jenkin et al., 1997). 기존 연구에서 계산된 광분해율은 단순히 태양과 천정이 이루는 각도인 태양 천정각 (solar zenith angle)을 사용하였기 때문에 구름, 에어로졸 등 자외선 복사 예측에 영향을 줄 수 있는 다양한 요인들이 고려되지 않는다는 한계점이 있다. 이렇게 예측된 OH radical 생성률은 과대평가될 수 있다. 본 연구에서는 대기 중에서 HONO 광분해를 일으키는 UV-A 세기를 직접 측정하여 HONO의 광분해 특성을 파악하였다 (Allaart et al., 2004; Hofzumahaus et al., 1999).
본 연구에서는 준실시간으로 측정된 HONO로부터 밤 사이 생성 및 낮 시간 광분해 특성을 규명하였다. 이 결과로부터 서울과 대전지역 겨울철 O3 생성 특성을 살펴보았다. 특히 대기 중 에어로졸 농도에 따른 HONO의 광분해 특성을 규명하고, 궁극적으로 O3 생성에 미치는 영향을 규명하였다.
2. 연구 방법
본 연구는 대한민국의 대표적인 도시인 서울과 지방 광역시 중 하나인 대전을 선정하여 겨울철 HONO와 O3의 생성 및 거동 특성을 규명하고, 특성을 비교하였다. 서울특별시 은평구 불광동에 위치한 수도권대기환경연구소와 대전광역시 유성구 도룡동에 위치한 한국표준과학연구원 (KRISS)에서 2020년 12월 15일에서 2021년 1월 14일까지 그리고 2022년 12월 01일에서 2022년 12월 31일까지 각각 1개월간 HONO와 여러 가스상 성분들을 측정하였다.
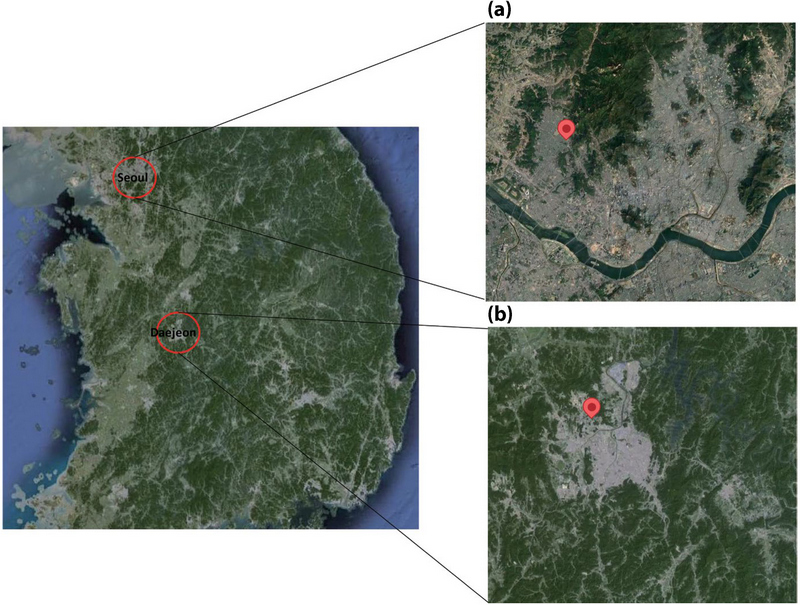
수도권대기환경연구소 (37.610°N, 126.933°E)가 위치한 서울의 면적은 605.23 km2이며 대한민국의 약 17% 이상의 인구인 약 938만 인구가 밀집되어 있는 대도시이다. 수도권대기환경연구소는 도심지역에 위치하고 있어 고층 건물이 많고 자동차 통행이 많아 여러 배출원에서 배출된 오염물질의 영향을 받는다 (Fig. 2a).
KRISS (36.389°N, 127.372°E)가 위치한 대전의 면적은 539.8 km2이며 약 144만 인구가 밀집되어 있는 도시이다. KRISS의 서쪽과 북서쪽은 농경지역으로 둘러싸여 있으며 북동 방향에 신탄진공단이 위치한다. 그리고 남쪽으로 약 4 km 거리에 대전광역시 도심이 위치하고 있다 (Fig. 2b).
2. 1 MARGA를 이용한 HONO 측정
MARGA (Metrohm Process Analytics, 2060)를 이용해 대기 중 HONO, SO2, HNO3, HCl, NH3 농도를 준실시간 간격으로 측정하였다. 대기 중 가스상 성분이 Wet Rotating Denuder (WRD)를 통과하며 H2O2가 포함된 수용액에 1시간 동안 액화 포집된 후 30분 간격으로 이온크로마토그래피 방법에 의해 분석되며 본 연구에서는 1시간 평균값을 이용하여 분석하였다 (Ok et al., 2023). 음이온은 Metrosep A Supp 7 column (150 mm×2.0 mm)을 통해 분리되었으며 이때 3.6 mM Na2CO3, 10 μM KIO3 수용액을 사용하였다.
수용성 이온 성분의 정량은 LiBr 내부 표준물질 (3680 μg L-1 Br-)을 사용하여 수행되었다. 장비 흡입 유량은 16.67 L/min로 유지하였으며, PM2.5 입경 분립 장치 (URG-2000-30EH, URG Corp., USA)를 이용하여 2.5 μm 이하 입자를 포집하여 분석하였다. HNO3, SO2, HONO의 검출 한계는 각각 0.05 μg m-3, 0.03 μg m-3, 0.02 μg m-3이며, MARGA 포집 효율은 99% 이상이다 (Stieger et al., 2018).
2. 2 SMPS를 이용한 나노입자 5경별 수농도 측정
Scanning mobility particle sizer (SMPS)를 이용해 약 10~480 nm 크기의 에어로졸 입경별 수농도를 측정하였다. SMPS는 Differential Mobility Analyzer (DMA)를 이용해 입자의 electrical mobility에 따라 입자를 크기별로 분리한다. 이후 condensation parti-cle counter (CPC)를 이용해 수농도를 측정한 뒤 식 3을 통해 aerosol surface area (SA)가 계산된다. 이때, D는 입자의 지름, n은 입경별 수농도를 의미한다 (Kuang et al., 2019).
| (3) |
대전지역은 GRIMM사의 SMPS (GRIMM, model 5.416), 서울지역은 TSI사의 SMPS (TSI, model 3936)를 이용해 실시간 측정을 수행하였고, 1시간 평균값을 분석에 활용하였다.
2. 3 NO2, O3 , PM2.5 농도
대전지역의 경우 molybdenum converter 방식의 화학발광법 (Kentek, MEZUS 210)을 이용해 NO2 농도를 실시간으로 측정하였고, UV 흡수법 (Kentek, MEZUS 410)을 이용해 O3 농도를 5분 간격으로 측정한 후 1시간 평균값을 분석에 활용하였다. 서울지역의 경우 수도권대기환경연구소와 동일한 곳에 위치한 불광동 대기환경측정소에서 측정된 NO, NO2, O3, PM2.5 농도의 1시간 평균값을 활용하였다. 외부 미세먼지의 한반도 유입 영향을 평가하기 위해 백령도에서 측정된 PM2.5를 활용하였다 (http://www.airkorea.or.kr).
2. 4 기상자료
대전지역의 UV-A는 320~400 nm 파장의 UV-A 센서 (KIPP&ZONEN, SUV-A)를 사용하여 KRISS에서 직접 측정하였으며, 서울지역은 수도권대기환경연구소 인근 기상청 측정소에서 UV-A Radiometer (Solar Light, model 501)를 사용하여 측정된 UV-A 자료를 제공받아 사용하였다. 풍향, 풍속, 상대습도 (RH: relative humidity), 전운량 (cloud cover) 등 기상자료는 기상청 자료를 사용하였다 (http://www.weather.go.kr).
3. 결과 및 고찰
3. 1 HONO의 시계열 분포
대전과 서울지역에서 각각 2022년 12월 01일에서 2022년 12월 31일, 2020년 12월 15일에서 2021년 1월 14일 1개월 동안 측정된 HONO, O3, NO2, RH, UV-A를 그림 3과 표 1에 나타냈다. 한 달 동안 측정된 대전지역 HONO 평균 농도는 0.7±0.6 ppbv로 과거 Kim et al. (2021)이 2021년 겨울철 대전에서 측정한 HONO 농도 2.6±1.9 ppbv에 비하여 약 3배 이상 낮았다. 서울에서 측정된 HONO 농도는 1.7±1.3 ppbv로 서울이 대전보다 높은 농도를 보였다. 이러한 수치는 Lee et al. (2005)이 2003년 겨울철 서울에서 측정한 HONO 농도 3.5±1.6 ppbv에 비하여 약 2배 낮았다. HONO 생성에 영향을 주는 NO2 농도는 대전지역이 16.6±10.6 ppbv, 서울 23.8±11.9 ppbv로 대전보다 서울이 높았다. 반면 O3 농도는 대전지역이 17.4±11.6 ppbv로 서울 15.8±9.6 ppbv보다 높았다. 평균 UV-A 세기는 대전과 서울지역이 각각 4.2±6.8 W/m2, 4.7±7.0 W/m2로 큰 차이는 보이지 않았지만 서울이 소폭 높았다.
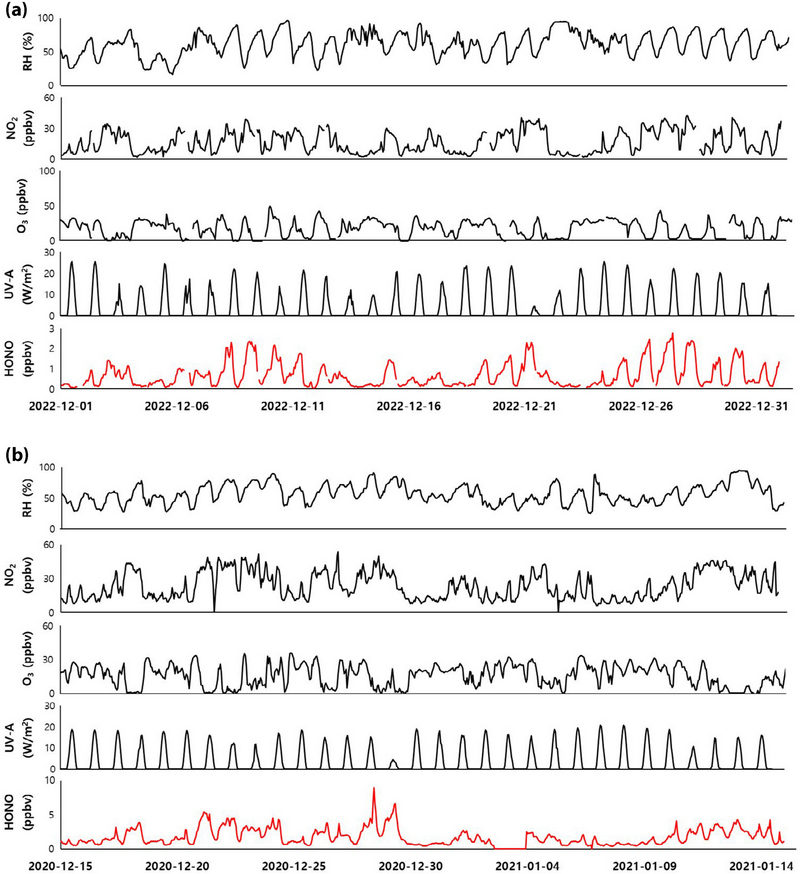
Temporal variations of RH, NO2, O3 , UV-A and HONO in (a) Daejeon (December 2022) and (b) Seoul (December 2020~January 2021).
본 연구에서 측정한 HONO, NO2, HONO/NO2 비를 선행 연구에서 얻어진 결과와 비교하여 표 2에 나타냈다. 대전지역에서 측정된 HONO 농도는 겨울철 카트만두, 베이징, 홍콩, 도쿄 지역에 비해 낮았고, 서울에서 측정된 농도는 겨울철 베이징, 홍콩, 도쿄 지역에 비해 높았다 (Zhang et al., 2022; Nakashima et al., 2017; Xu et al., 2015; Spataro et al., 2013; Yu et al., 2009). HONO/NO2 비를 비교하였을 때에는 대전과 서울지역이 각각 0.04와 0.05로 표 2에 나타낸 선행 연구와 비교해 상대적으로 낮았다. 과거 대전과 서울 측정 결과와 비교하였을 때 대전의 경우 Kim et al. (2021)에 비하여 HONO의 농도가 약 3배 이상 낮은 것을 볼 수 있었다. 이는 NO2의 농도 감소와 관련이 있을 것으로 추측되며 서울의 경우 Gil et al. (2023)과 HONO 농도 및 HONO/NO2 ratio가 유사한 값을 보였다.
3. 2 도시대기 HONO 생성 특성
HONO는 NO2의 heterogeneous reaction에 의해 밤시간 동안 활발하게 생성되며 NO2, RH 그리고 aerosol surface area 세 가지 요인에 의해 영향을 받는 것이 다수의 선행 연구에서 보고되었다 (Kurtenbach et al., 2001). HONO 생성의 전구물질인 NO2와 HONO 농도 사이의 상관관계를 파악하기 위해 산포도를 그림 4a, b에 나타냈다. 밤 시간 HONO 생성 특성을 파악하고자 UV-A가 약한 시간대인 오후 6시부터 익일 오전 7시까지 자료만 사용하였다. 대전과 서울지역 모두 NO2와 HONO 사이의 선형회귀식의 결정계수 (R2)가 각각 0.78, 0.8로 좋은 상관관계를 보였다. 선행 연구에 따르면 차량에서 직접 배출되는 HONO는 NO2 농도의 약 0.18~1.31%로 보고되었다 (Gil et al., 2023; Liang et al., 2017; Trinh et al., 2017). 본 연구에서 HONO의 생성이 활발한 저녁 6시에서 익일 오전 7시까지 대전과 서울에서 HONO/NO2 비율은 각각 3.3%, 6.3%였다. 이 결과로부터 대전과 서울지역의 경우 차량에서 직접 배출되는 HONO의 기여량이 크지 않음을 유추할 수 있다.
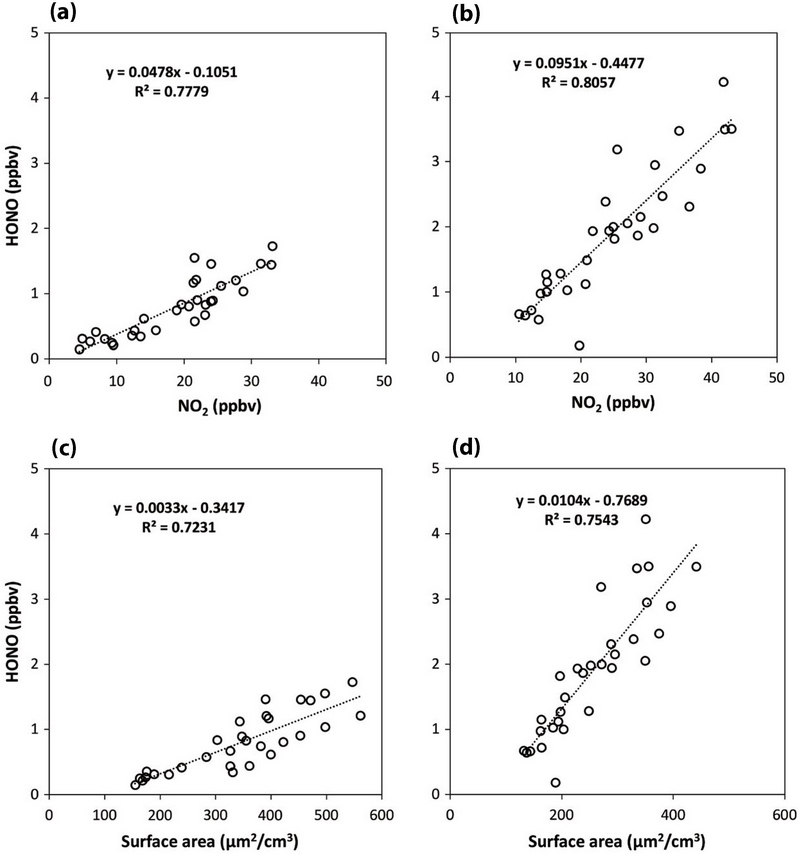
The scatter plots of HONO versus NO2 (a, b) and HONO versus aerosol surface area (c, d) from 6 P.M. to 7 A.M. in Daejeon (a, c) and Seoul (b, d).
다수의 선행 연구에서 에어로졸과 HONO의 상관관계는 실험실 조건 내에서 증명된 바 있으며 HONO 생성에 있어 aerosol surface area는 화학반응이 일어날 수 있는 활성 표면을 제공한다는 점에서 매우 중요한 인자이다 (Kalberer et al., 1999). 대전과 서울지역 aerosol surface area와 HONO의 상관관계를 비교하여 그림 4c, d에 나타냈다. 대전과 서울지역 모두 선형회귀식의 결정계수는 각각 0.72, 0.75로 높은 상관관계를 보였다. 이 결과로부터 대전과 서울지역 모두 밤 사이 aerosol surface area에 영향을 받아 heterogeneous reaction을 통해 HONO 생성이 활발하게 이루어졌음을 알 수 있다.
오후 6시부터 익일 오전 7시 사이 평균 NO2 농도에 따라 4구간으로 나누어 HONO와 RH의 산포도를 그림 5에 나타냈다. 대전과 서울 모두 NO2의 농도가 높고 RH가 높을수록 HONO의 농도가 증가하는 경향성을 확인할 수 있었다. 그림 4와 5의 결과로부터 대전과 서울 모두 heterogeneous reaction으로 생성되는 HONO는 NO2, H2O, aerosol surface area의 영향을 모두 받는 것을 확인할 수 있다. 다만 유사한 상대습도 조건에서는 HONO의 생성이 대전과 서울지역 모두 NO2에 지배되는 것을 확인할 수 있다. 그림 4a, b에 보이는 것처럼 유사한 NO2 농도 수준에서는 서울지역 HONO 농도가 대전보다 높은 것을 확인할 수 있다.
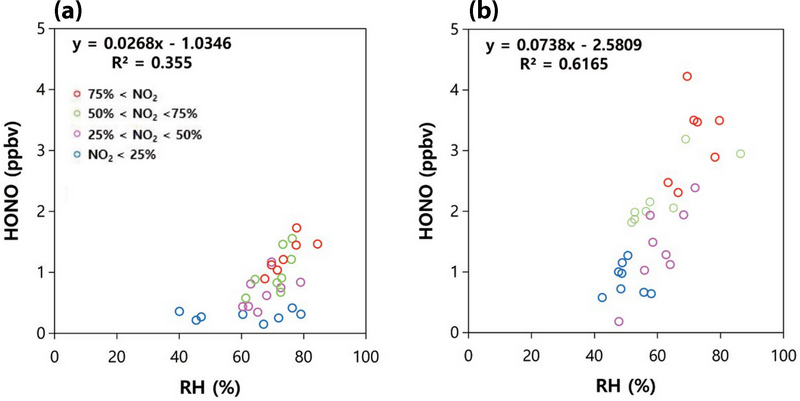
Scatter plots of HONO versus RH according to NO2 level in (a) Daejeon and (b) Seoul during 6 P.M.~7 A.M.
그림 4c, d에 보이는 것처럼 서울이 대전보다 aerosol surface area와 HONO 농도 사이 상관관계가 더 높았고, 건물 밀집도 또한 높은 인구 밀도로 인해 서울이 대전보다 높다. 따라서 유사한 NO2 농도 수준에서 서울지역 HONO 농도가 상대적으로 높은 것은 에어로졸이나 건물 표면에서 heterogeneous reaction에 의한 HONO 생성이 대전보다 서울에서 더 활발히 진행되었다는 것으로 설명될 수 있다.
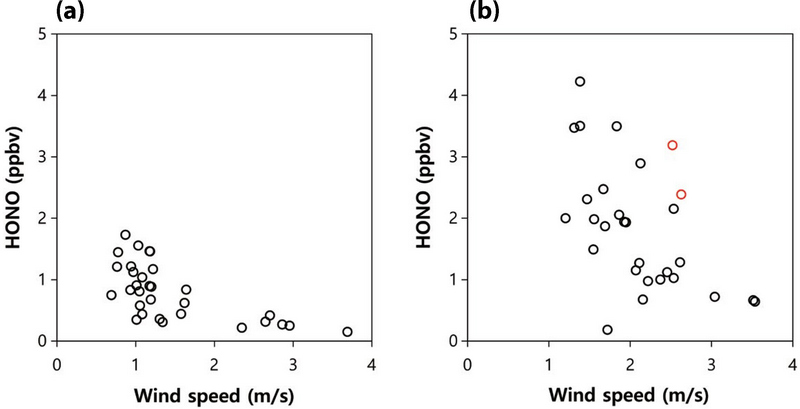
오후 6시부터 익일 오전 7시 사이 HONO 농도와 풍속의 산포도를 그림 6에 나타냈다. 대전지역은 풍속이 증가할수록 HONO가 감소하는 경향성을 보였다. 서울지역도 풍속이 증가하면서 HONO가 감소하는 경향성은 보였지만, 그림 6b에 붉은색으로 표시된 것과 같이 풍속이 비교적 강하지만 HONO의 농도가 높은 기간을 확인할 수 있었다. 붉은색으로 표시된 기간인 2020년 12월 24일과 29일 모두 밤 시간대 서풍이 유지되고, 위성영상으로부터 오염띠가 서해를 거쳐 유입되는 것을 확인하였다. 하지만 표시된 기간에 NO2 농도 및 RH가 다른 기간과 유사하거나 낮은 것을 볼 수 있었다. 이 결과로부터 표시된 기간 동안 HONO의 고농도 원인이 NO2와 RH에 의한 HONO의 생성기작뿐만 아니라 외부에서 생성된 HONO가 도심으로도 유입되어 서울지역 대기에 영향을 주었음을 추측할 수 있었다.
3. 3 도시대기 중 HONO의 광분해 특성
대전과 서울지역 전체 측정 기간 평균 UV-A와 HONO의 일변화 경향을 그림 7에 나타냈다. UV-A가 매우 낮아지는 오후 6시 이후부터 HONO가 지속적으로 증가하여 익일 오전 8시 전후에 가장 높은 농도를 보였다. 이후 UV-A가 증가함에 따라 HONO 농도가 급격히 감소하는 일변화 경향성을 나타냈다. UV-A는 오전 8시부터 증가하여 오후 12시 전후에 가장 높은 세기가 관측되었다. 그림 7에 보이는 바와 같이 UV-A와 HONO의 일변화 경향은 서울과 대전이 유사하게 나타났다.
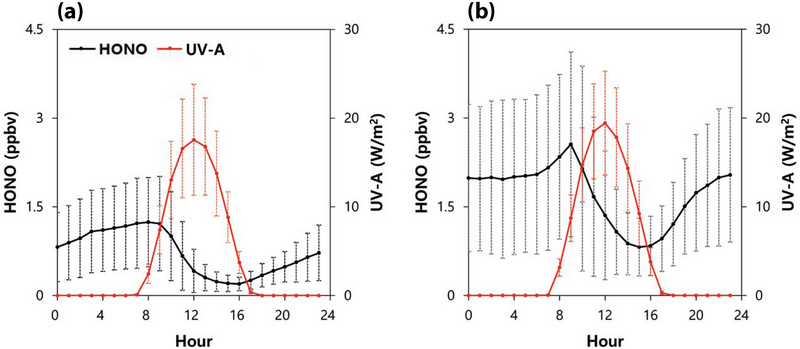
Diurnal variations of average HONO concentration and UV-A intensity in (a) Daejeon and (b) Seoul during the entire measurement period. Error bar represents standard deviation.
UV-A가 증가하기 시작하는 오전 8시~오전 10시 사이 UV-A intensity의 시간 평균에 따른 HONO 농도 변화 백분율을 그림 8에 나타냈다. HONO 변화량 백분율은 식 4를 이용하여 계산하였다.
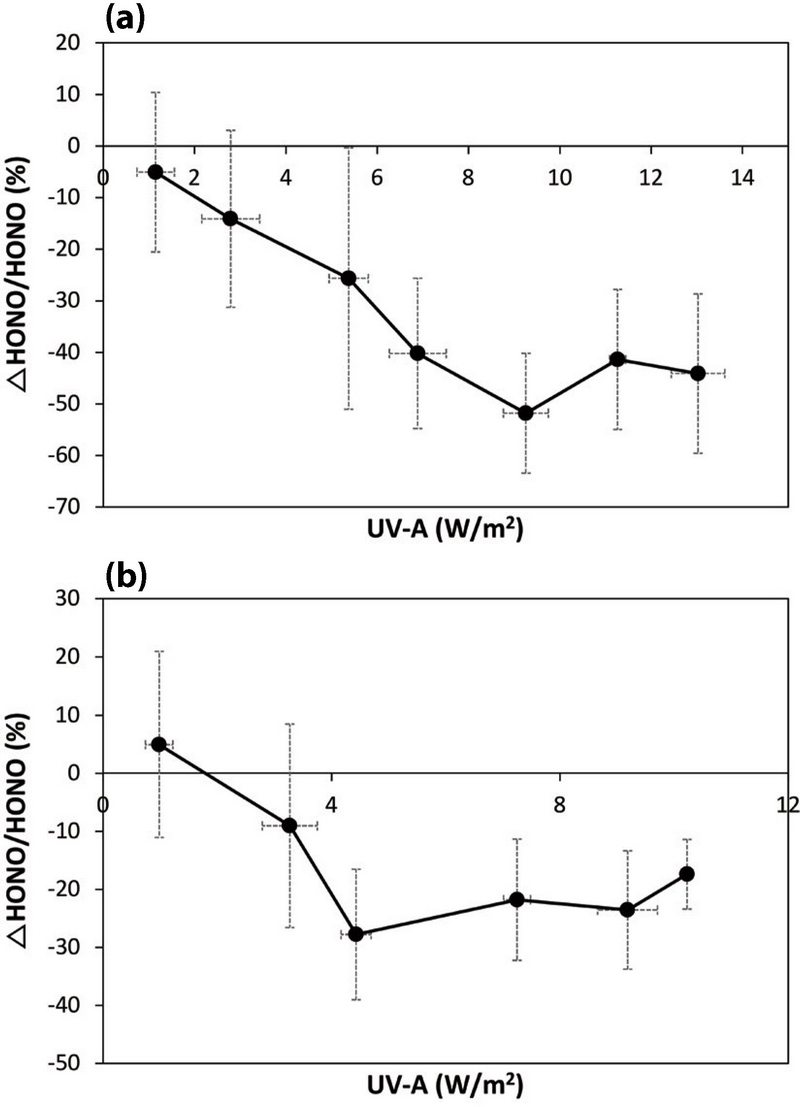
Average ΔHONO/HONO fraction as a function of UV-A intensity in (a) Daejeon and (b) Seoul during 8 A. M.~10 A.M.
| (4) |
여기서, [HONOi]는 시각이 i일 때 HONO의 농도이고, [HONOi-1]는 한 시간 전의 HONO 농도를 의미한다. UV-A에 의해 HONO가 광분해되어 농도가 감소하면 △HONO 백분율은 음의 값을 가진다. 대전과 서울지역 모두 UV-A가 증가함에 따라 시간당 HONO 농도 감소 비율이 증가하였고, UV-A가 약 4 W/m2 이상일 때 시간당 HONO 농도가 감소하는 비율이 유사하게 유지되었다.
구름이 많이 끼거나 대기 중 입자의 농도가 증가하면 빛의 산란 및 흡수를 통해 지표에 도달하는 UV-A가 감소한다. UV-A가 증가하는 오전 8시부터 가장 높은 값에 도달하는 오후 2시 사이 aerosol surface area 농도에 따른 전운량과 UV-A intensity의 시계열 변화를 그림 9에 나타내고, 전체 평균값을 표 3과 4에 나타냈다. Aerosol surface area에 따라 하위 33%는 Low (파랑), 33~66%는 Medium (검정), 66% 이상은 High (빨강) 기간으로 구분하였으며, 강수가 발생한 날은 제외하였다.
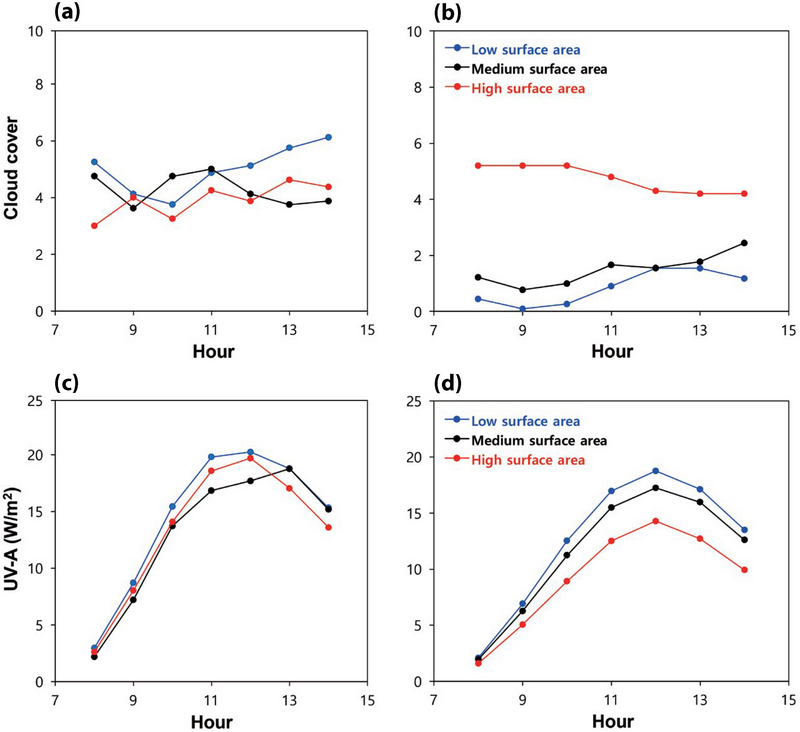
Diurnal changes (from 8 A.M. to 2 P.M.) in average (a, b) cloud cover and (c, d) UV-A intensity according to aerosol surface area in (a, c) Daejeon and (b, d) Seoul.

Summary of cloud cover, UV-A, NO2, RH, and HONO in Daejeon according to aerosol surface area during 8 A.M.~2 P.M.

Summary of cloud cover, UV-A, NO2, RH, and HONO in Seoul according to aerosol surface area during 8 A.M.~2 P.M.
그림 9와 표 3에 나타낸 바와 같이 대전지역의 경우 aerosol surface area가 Low인 기간에 비교해 Medium과 High 기간에 UV-A가 감소하였다. 전운량의 경우 aerosol surface area가 증가함에 따라 소폭 감소하였다. 일반적으로 전운량이 증가하면 태양으로부터 지표에 도달하는 UV-A의 산란을 증가시켜 UV-A가 감소하게 된다. 하지만 표 3에 보이는 바와 같이 대전지역의 경우 전운량이 감소함에 따라 UV-A도 소폭 감소하는 경향을 나타내었다. 이 결과로부터 대전지역의 경우 UV-A의 감소는 전운량보다는 aerosol surface area의 영향을 받았음을 유추할 수 있다. 하지만 aerosol surface area에 따른 전운량과 UV-A의 변화량이 크지가 않아 이에 대한 추가적인 연구가 필요하다.
그림 9와 표 4에 나타낸 바와 같이 서울지역의 경우 aerosol surface area가 Low에서 Medium, High로 증가함에 따라 전운량은 증가하고 UV-A는 감소하는 경향을 나타내었다. 특히 aerosol surface area가 High인 기간에 전운량이 급격히 증가하고, UV-A가 크게 감소하는 것을 확인할 수 있었다. 이 결과로부터 서울지역 UV-A 감소는 전운량과 aerosol surface area 모두에 영향을 받았음을 유추할 수 있다.
표 3과 4에 나타낸 바와 같이 대전과 서울지역 모두 aerosol surface area가 Low인 기간에 비해 High인 기간 평균 RH가 증가한 것을 확인할 수 있다. RH 증가하면 에어로졸의 흡습성장이 증가하고 이로 인해 빛 산란 효율이 증가하게 된다. 대전과 서울지역 모두 aerosol surface area가 High인 기간에는 높은 RH 조건으로 인해 빛 산란량이 증가하고, 이로 인해 UV-A 감소가 추가로 기여하였음을 유추할 수 있다.
Aerosol surface area 분류에 따라 오전 8시에서 오후 2시 사이 전운량, UV-A, NO2, RH, HONO 평균값을 표 3과 4에 나타냈다. 대전과 서울 모두 aerosol surface area가 Low에서 High로 증가할 때 NO2, RH, HONO는 증가하는 경향을 나타냈다. 대전과 서울 지역 모두 aerosol surface area가 Low 기간에 비해 High 기간일 때 NO2와 HONO 농도가 약 2~3배 증가하였다.
서론에서 언급한 것처럼 밤 시간에 aerosol surface area가 증가하면 NO2의 heterogeneous reaction에 의해 HONO 생성이 증대된다. 하지만 표 3과 4는 오전 8시에서 오후 2시까지 측정된 결과이기 때문에 HONO 농도 증가가 HONO 생성량 증가라고 설명하기에는 한계가 있다. Aerosol surface area 증가에 따라 대전과 서울지역 모두 UV-A가 감소하는 경향을 나타냈기 때문에 NO2와 HONO 농도 증가는 UV-A 감소에 따라 광화학 반응이 활발히 일어나지 않고, 이로 인한 대기 중 체류시간 증가가 원인이 될 수 있음을 추측할 수 있다. 하지만 낮 시간에 배출원으로부터 NO의 배출이 많은 날의 경우 NO와 O3의 반응에 의해 O3 농도 증가가 억제될 수 있어 이에 대한 추가적인 연구가 필요하다.
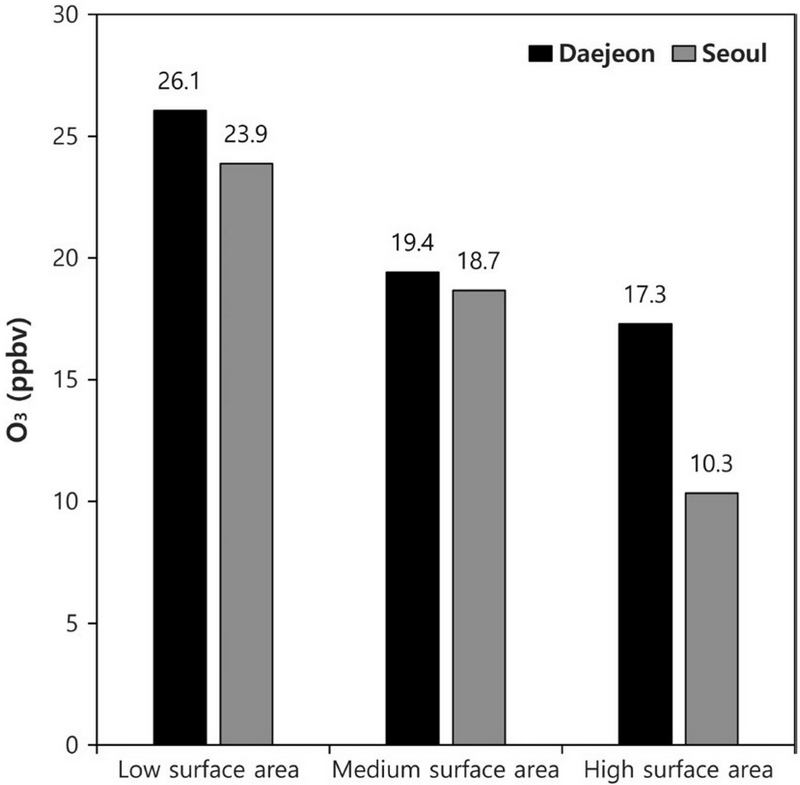
Aerosol surface area 분류에 따른 O3 평균 농도를 그림 10에 나타냈다. 대전과 서울 모두 aerosol surface area가 높아짐에 따라 O3 농도가 낮아지는 경향을 보였다. 서울지역의 경우 대전에 비해 aerosol surface area가 High인 기간에 O3 농도가 급격히 감소한 것을 확인할 수 있다. 표 3과 4로부터 서울지역의 경우 aerosol surface area 증가에 따른 O3 농도 감소는 전운량 증가와 aerosol surface area 증가에 따른 UV-A 감소로 인해 O3 생성에 영향을 주는 광화학 반응이 활발하게 일어나지 않은 것이 주 원인으로 유추할 수 있다. 대전지역도 서울지역과 유사한 원인으로 인해 aerosol surface area 증가에 따라 O3 생성이 저해되었음을 유추할 수 있었다. 하지만 대전지역의 경우 UV-A와 전운량, aerosol surface area와의 명확한 상관관계를 보이지는 않았다.
집중측정기간 동안 aerosol surface area의 외부 영향을 살펴보기 위해 동북아지역의 위성사진을 그림 11에 나타냈다. 서해와 한반도에 오염물질 띠가 관측되지 않은 2022년 12월 18일 (a)의 경우 대전지역에서 aerosol surface area가 191.5 μm2/cm3로 낮게 측정되었으며 평균 풍속이 1.6 m/s로 약해 외부로부터의 에어로졸 유입 영향이 적을 것임을 시사할 수 있다. 반면 오염원으로부터 Haze의 유입이 관찰된 2022년 12월 27일 (b)의 경우 aerosol surface area가 641 μm2/cm3로 약 3배 이상 증가하였다. 서울지역에서도 유사한 경향이 나타났다. 서해와 한반도에 오염물질 띠가 관측되지 않은 2021년 1월 2일 (c) aerosol surface area가 150 μm2/cm3로 비교적 낮게 관측되었으며 평균 풍속이 2.4 m/s로 약해 외부로부터의 영향이 적을 것임을 유추할 수 있다. 그러나 오염원으로부터 Haze가 유입된 2020년 12월 22일 서울 지역의 aerosol surface area는 각각 499 μm2/cm3로 약 3배 이상 증가한 것을 볼 수 있다.
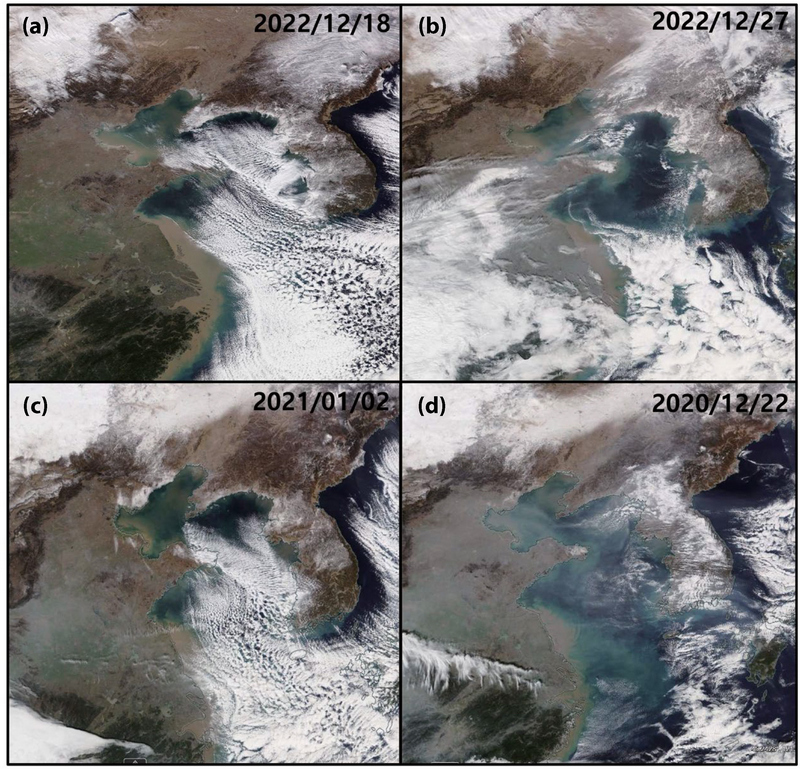
NOAA satellite image over the Northeast Asia. (a) and (b) are during low and high aerosol surface area in Daejeon, respectively whereas (c) and (d) are for Seoul.
외부 유입의 영향을 살펴보기 위해 서풍 계열의 바람이 불 때 풍상지역인 백령도와 불광동이 위치한 서울측정소에서 측정된 PM2.5 농도의 시계열 변화를 그림 12에 나타냈다. 그림 11에 위성자료에서 언급한 외부 유입사례 기간인 2020년 12월 22일 전후 PM2.5 농도를 살펴보면 백령도에서 서울로 순차적으로 농도가 높아지는 것을 확인할 수 있다. 12월 28일 전후 역시 유사한 경향을 나타내었다. 위성사진 및 지표 측정 결과로부터 aerosol surface area가 높은 날은 장거리 유입된 입자상 에어로졸의 영향을 받은 것을 확인할 수 있었다.

Temporal variations of PM2.5 concentrations measured at the Baengnyung Island (upwind) and Bulkwang sites in Seoul.
Aerosol surface area에 따른 대전과 서울지역 HONO 광분해 및 오존 생성 기작을 그림 13에 나타냈다. 낮 시간 UV-A에 의해 광분해된 HONO로부터 생성된 OH radical은 VOCs를 산화시킨다. 또한 OH radical은 NOx cycle에 영향을 주어 O3 생성에 기여한다 (Fig. 13a). 전운량이 많거나 장거리 이동을 통하여 많은 양의 입자상 에어로졸이 유입되면 빛의 산란 및 흡수량이 증가하여 지표에 도달하는 UV-A가 감소한다. 감소된 UV-A로 인해 HONO로부터 OH radical 생성이 활발히 일어나지 않을 뿐만 아니라 NOx cycle의 광분해에 영향을 주어 최종적으로 O3 생성이 억제된다 (Fig. 13b). 하지만 대기 중 O3 농도는 낮 시간 배출원으로부터 NO 배출량이 많은 날의 경우 O3와 NO의 반응으로 인해 O3 생성이 억제될 수 있기 때문에 이에 대한 추가적인 연구가 필요하다.
4. 결 론
본 연구에서는 겨울철 도심지역 대기 중 HONO의 생성 및 광분해 특성이 O3 생성에 미치는 영향을 규명하기 위해 HONO 및 다양한 가스상 성분과 기상 요소를 분석하였다. 측정 기간 중 HONO 농도는 대전과 서울지역이 각각 0.7±0.6 ppbv, 1.7±1.3 ppbv였다. 대전과 서울지역 모두 밤사이 HONO 생성은 NO2와 aerosol surface area와 밀접한 관련이 있는 것을 확인할 수 있었으며 중국에서 Haze가 유입될 때 aerosol surface area가 급격히 증가하였다. Aerosol surface area 및 전운량의 증가로 인해 빛의 산란, 흡수량이 증가하여 UV-A를 감소시키는 것을 확인할 수 있었으며 결과적으로 UV-A 감소는 HONO로부터 OH radical을 저하시키고, NOx cycle에도 영향을 주어 O3 생성을 저하시킨다는 것이 측정 결과를 바탕으로 확인되었다. 본 연구 결과로부터 도심지역인 서울과 대전지역에서 겨울철 오존과 초미세먼지 생성에 중요한 역할을 하는 HONO의 관리를 위해서는 저녁과 밤 시간 NO2의 배출 제어가 가장 효과적임을 유추할 수 있다.
Acknowledgments
이 연구는 한국표준과학연구원 기본사업인 “2차 생성 질소산화물 측정표준확립 (24011091)”의 연구비 지원을 받아 수행되었습니다.
References
-
Alicke, B., Geyer, A., Hofzumahaus, A., Holland, F., Konrad, S., Pätz, H.W., Schäfer, J., Stutz, J., Volz, T.A., Platt, U. (2003) OH formation by HONO photolysis during the BERLIOZ experiment, Journal of Geophysical Research: Atmospheres, 108(D4), PHO-3.
[https://doi.org/10.1029/2001JD000579]

-
Allaart, M., van Weele, M., Fortuin, P., Kelder, H. (2004) An empirical model to predict the UV-index based on solar zenith angles and total ozone, Meteorological Applications, 11(1), 59-65.
[https://doi.org/10.1017/S1350482703001130]

-
Andersen, S.T., Carpenter, L.J., Reed, C., Lee, J.D., Chance, R., Sherwen, T., Vaughan, A.R., Stewart, J., Edwards, P.M., Bloss, W.J., Sommariva, R., Crilley, L.R., Nott, G.J., Neves, L., Read, K., Heard, D.E., Seakins, P.W., Whalley, L.K., Boustead, G.A., Fleming, L.T., Stone, D., Fomba, K.W. (2023) Extensive field evidence for the release of HONO from the photolysis of nitrate aerosols, Science Advances, 9(3), eadd6266.
[https://doi.org/10.1126/sciadv.add6266]

-
Chou, C.C.K., Tsai, C.Y., Shiu, C.J., Liu, S.C., Zhu, T. (2009) Measurement of NOy during campaign of air quality research in Beijing 2006 (CAREBeijing-2006): Implications for the ozone production efficiency of NOx, Journal of Geophysical Research: Atmospheres, 114 (D2).
[https://doi.org/10.1029/2008JD010446]

- Finlayson-Pitts, B.J., Pitts Jr, J.N. (2000) Chemistry of the upper and lower atmosphere: theory, experiments, and applications. Elsevier.
-
Gil, J., Kim, J., Lee, M., Lee, G., Ahn, J., Lee, D.S., Jung, J., Cho, S., Whitehill, A., Szykman, J., Lee, J. (2021) Characteristics of HONO and its impact on O3 formation in the Seoul Metropolitan Area during the Korea-US Air Quality study, Atmospheric Environment, 247, 118182.
[https://doi.org/10.1016/j.atmosenv.2020.118182]

-
Gil, J., Lee, M., Lee, H., Jang, J. (2023) Seasonal Characteristics of HONO Variations in Seoul during 2021-2022, Journal of Korean Society for Atmospheric Environment, 39(3), 308-319.
[https://doi.org/10.5572/KOSAE.2023.39.3.308]

-
Gil, J., Son, J., Kang, S., Park, J., Lee, M., Jeon, M., Shim, M. (2020) HONO Measurement in Seoul during Summer 2018 and its Impact on Photochemistry, Journal of Korean Society for Atmospheric Environment, 36(5), 579-588.
[https://doi.org/10.5572/KOSAE.2020.36.5.579]

-
Gligorovski, S., Strekowski, R., Barbati, S., Vione, D. (2015) Environmental implications of hydroxyl radicals (· OH), Chemical Reviews, 115(24), 13051-13092.
[https://doi.org/10.1021/cr500310b]

-
Goodman, A.L., Underwood, G.M., Grassian, V.H. (1999) Heterogeneous reaction of NO2: characterization of gasphase and adsorbed products from the reaction, 2NO2 (g)+ H2O (a) → HONO (g)+ HNO3 (a) on hydrated silica particles, The Journal of Physical Chemistry A, 103(36), 7217-7223.
[https://doi.org/10.1021/jp9910688]

-
Hofzumahaus, A., Kraus, A., Müller, M. (1999) Solar actinic flux spectroradiometry: A technique for measuring photolysis frequencies in the atmosphere, Applied Optics, 38(21), 4443-4460.
[https://doi.org/10.1364/AO.38.004443]

-
Hu, B., Chen, G., Chen, J., Xu, L., Fan, X., Hong, Y., Li, M., Lin, Z., Huang, M., Zhang, F., Wang, H. (2023) The effect of nitrous acid (HONO) on ozone formation during pollution episodes in southeastern China: Results from model improvement and mechanism insights, Science of The Total Environment, 891, 164477.
[https://doi.org/10.1016/j.scitotenv.2023.164477]

-
Jenkin, M.E., Saunders, S.M., Pilling, M.J. (1997) The tropospheric degradation of volatile organic compounds: a protocol for mechanism development, Atmospheric Environment, 31(1), 81-104.
[https://doi.org/10.1016/S1352-2310(96)00105-7]

-
Kalberer, M., Ammann, M., Arens, F., Gäggeler, H.W., Baltensperger, U. (1999) Heterogeneous formation of nitrous acid (HONO) on soot aerosol particles, Journal of Geophysical Research: Atmospheres, 104(D11), 13825-13832.
[https://doi.org/10.1029/1999JD900141]

-
Kim, K., Lee, C., Han, S., Choi, D., Lee, S., Eom, J., Lee, S., Han, J. (2021) A Study on the Formation Reactions and Conversion Mechanisms of HONO in the Atmosphere, Journal of the Korean Society of Urban Environment, 21(4), 233-241.
[https://doi.org/10.33768/ksue.2021.21.4.233]

-
Klosterköther, A., Kurtenbach, R., Wiesen, P., Kleffmann, J. (2021) Determination of the emission indices for NO, NO2, HONO, HCHO, CO, and particles emitted from candles, Indoor Air, 31(1), 116-127.
[https://doi.org/10.1111/ina.12714]

-
Kramer, L.J., Crilley, L.R., Adams, T.J., Ball, S.M., Pope, F.D., Bloss, W.J. (2020) Nitrous acid (HONO) emissions under realworld driving conditions from vehicles in a UK road tunnel, Atmospheric Chemistry and Physics, 20(9), 5231-5248.
[https://doi.org/10.5194/acp-20-5231-2020]

-
Kuang, Y., Tao, J., Xu, W., Yu, Y., Zhao, G., Shen, C., Bian, Y., Zhao, C. (2019) Calculating ambient aerosol surface area concentrations using aerosol light scattering enhancement measurements, Atmospheric Environment, 216, 116919.
[https://doi.org/10.1016/j.atmosenv.2019.116919]

-
Kurtenbach, R., Becker, K.H., Gomes, J.A.G., Kleffmann, J., Lörzer, J.C., Spittler, M., Wiesen, P., Ackermann, R., Geyer, A., Platt, U. (2001) Investigations of emissions and heterogeneous formation of HONO in a road traffic tunnel, Atmospheric Environment, 35(20), 3385-3394.
[https://doi.org/10.1016/S1352-2310(01)00138-8]

-
Lee, C., Kim, Y.J., Hong, S.B., Lee, H., Jung, J., Choi, Y.J., Park, J., Kim, K.H., Lee, J.H., Chun, K.J., Kim, H.H. (2005) Measurement of atmospheric formaldehyde and monoaromatic hydrocarbons using differential optical absorption spectroscopy during winter and summer intensive periods in Seoul, Korea, Water, Air, and Soil Pollution, 166, 181-195.
[https://doi.org/10.1007/s11270-005-7308-6]

-
Liang, Y., Zha, Q., Wang, W., Cui, L., Lui, K.H., Ho, K.F., Wang, Z., Lee, S., Wang, T. (2017) Revisiting nitrous acid (HONO) emission from on-road vehicles: A tunnel study with a mixed fleet, Journal of the Air & Waste Management Association, 67(7), 797-805.
[https://doi.org/10.1080/10962247.2017.1293573]

-
Lim, S., Lee, M., Savarino, J., Laj, P. (2022) Oxidation pathways and emission sources of atmospheric particulate nitrate in Seoul: based on δ15N and Δ17O measurements, Atmospheric Chemistry and Physics, 22(8), 5099-5115.
[https://doi.org/10.5194/acp-22-5099-2022]

-
Liu, Y., Lu, K., Ma, Y., Yang, X., Zhang, W., Wu, Y., Peng, J., Shuai, S., Hu, M., Zhang, Y. (2017) Direct emission of nitrous acid (HONO) from gasoline cars in China determined by vehicle chassis dynamometer experiments, Atmospheric Environment, 169, 89-96.
[https://doi.org/10.1016/j.atmosenv.2017.07.019]

-
Nakashima, Y., Sadanaga, Y., Saito, S., Hoshi, J., Ueno, H. (2017) Contributions of vehicular emissions and secondary formation to nitrous acid concentrations in ambient urban air in Tokyo in the winter, Science of The Total Environment, 592, 178-186.
[https://doi.org/10.1016/j.scitotenv.2017.03.122]

- Ok, S., Moon, J., Lee, H., Kim, N., Yang, J., Jun, J. (2023) Evaluation of Detection Efficiency of HONO, HNO3, and SO2 by a MARGA Wet Rotating-Denuder, Journal of Korean Society for Atmospheric Environment, 39(4), 557-566.
-
Oswald, R., Behrendt, T., Ermel, M., Wu, D., Su, H., Cheng, Y., Breuninger, C., Moravek, A., Mougin, E., Delon, C., Loubet, B., Röser, A.P., Sörgel, M., Pöschl, U., Hoffmann, T., Andreae, M.O., Meixner, F.X., Trebs, I. (2013) HONO emissions from soil bacteria as a major source of atmospheric reactive nitrogen, Science, 341(6151), 1233-1235.
[https://doi.org/10.1126/science.1242266]

-
Pagsberg, P., Bjergbakke, E., Ratajczak, E., Sillesen, A. (1997) Kinetics of the gas phase reaction OH+NO(+M) → HONO( +M) and the determination of the UV absorption cross sections of HONO, Chemical Physics Letters, 272(5-6), 383-390.
[https://doi.org/10.1016/S0009-2614(97)00576-9]

-
Peng, Q., Palm, B.B., Melander, K.E., Lee, B.H., Hall, S.R., Ullmann, K., Campos, T., Weinheimer, A.J., Apel, E.C., Hornbrook, R.S., Hills, A.J., Montzka, D.D., Flocke, F., Hu, L., Permar, W., Wielgasz, C., Lindaas, J., Pollack, I.B., Fischer, E.V., Bertram, T.H., Thornton, J.A. (2020) HONO emissions from western US wildfires provide dominant radical source in fresh wildfire smoke, Environmental Science & Technology, 54(10), 5954-5963.
[https://doi.org/10.1021/acs.est.0c00126]

-
Reisinger, A.R. (2000). Observations of HNO2 in the polluted winter atmosphere: possible heterogeneous production on aerosols, Atmospheric Environment, 34(23), 3865- 3874.
[https://doi.org/10.1016/S1352-2310(00)00179-5]

-
Ryan, R.G., Rhodes, S., Tully, M., Wilson, S., Jones, N., Frieß, U., Schofield, R. (2018) Daytime HONO, NO2 and aerosol distributions from MAX-DOAS observations in Melbourne, Atmospheric Chemistry and Physics, 18(19), 13969-13985.
[https://doi.org/10.5194/acp-18-13969-2018]

-
Saunders, S.M., Jenkin, M.E., Derwent, R.G., Pilling, M.J. (2003) Protocol for the development of the Master Chemical Mechanism, MCM v3 (Part A): tropospheric degradation of non-aromatic volatile organic compounds, Atmospheric Chemistry and Physics, 3(1), 161-180.
[https://doi.org/10.5194/acp-3-161-2003]

-
Spataro, F., Ianniello, A., Esposito, G., Allegrini, I., Zhu, T., Hu, M. (2013) Occurrence of atmospheric nitrous acid in the urban area of Beijing (China), Science of The Total Environment, 447, 210-224.
[https://doi.org/10.1016/j.scitotenv.2012.12.065]

-
Stieger, B., Spindler, G., Fahlbusch, B., Müller, K., Grüner, A., Poulain, L., Thöni, L., Seitler, E., Wallasch, M., Herrmann, H. (2018) Measurements of PM10 ions and trace gases with the online system MARGA at the research station Melpitz in Germany - A five-year study, Journal of Atmospheric Chemistry, 75, 33-70.
[https://doi.org/10.1007/s10874-017-9361-0]

-
Su, H., Cheng, Y., Oswald, R., Behrendt, T., Trebs, I., Meixner, F.X., Andreae, M.O., Cheng, P., Zhang, Y., Pöschl, U. (2011) Soil nitrite as a source of atmospheric HONO and OH radicals, Science, 333(6049), 1616-1618.
[https://doi.org/10.1126/science.1207687]

-
Theys, N., Volkamer, R., Müller, J.F., Zarzana, K.J., Kille, N., Clarisse, L., Smedt, I.D., Lerot, C., Finkenzeller, H., Hendrick, F., Koenig, T.K., Lee, C.F., Knote, C., Yu, H., Van Roozendael, M. (2020) Global nitrous acid emissions and levels of regional oxidants enhanced by wildfires, Nature Geoscience, 13(10), 681-686.
[https://doi.org/10.1038/s41561-020-0637-7]

-
Trinh, H.T., Imanishi, K., Morikawa, T., Hagino, H., Takenaka, N. (2017) Gaseous nitrous acid (HONO) and nitrogen oxides (NOx) emission from gasoline and diesel vehicles under real-world driving test cycles, Journal of the Air & Waste Management Association, 67(4), 412- 420.
[https://doi.org/10.1080/10962247.2016.1240726]

-
Wang, Y., Fu, X., Wu, D., Wang, M., Lu, K., Mu, Y., Liu, Z., Zhang, Y., Wang, T. (2021) Agricultural fertilization aggravates air pollution by stimulating soil nitrous acid emissions at high soil moisture, Environmental Science & Technology, 55(21), 14556-14566.
[https://doi.org/10.1021/acs.est.1c04134]

-
Weber, B., Wu, D., Tamm, A., Ruckteschler, N., Rodríguez-Caballero, E., Steinkamp, J., Meusel, H., Elbert, W., Behrendt, T., Sörgel, M., Cheng, Y., Crutzen, P.J., Su, H., Pöschl, U. (2015) Biological soil crusts accelerate the nitrogen cycle through large NO and HONO emissions in drylands, Proceedings of the National Academy of Sciences, 112(50), 15384-15389.
[https://doi.org/10.1073/pnas.1515818112]

-
Wolfe, G.M., Marvin, M.R., Roberts, S.J., Travis, K.R., Liao, J. (2016) The framework for 0-D atmospheric modeling (F0AM) v3. 1, Geoscientific Model Development, 9(9), 3309-3319.
[https://doi.org/10.5194/gmd-9-3309-2016]

-
Wu, D., Horn, M.A., Behrendt, T., Müller, S., Li, J., Cole, J.A., Xie, B., Ju, X., Li, G., Ermel, M., Oswald, R., Nowoisky, J.F., Hoor, P., Hu, C., Liu, M., Andreae, M.O., Pöschl, U., Cheng, Y., Su, H., Trebs, I., Weber, B., Sörgel, M. (2019) Soil HONO emissions at high moisture content are driven by microbial nitrate reduction to nitrite: tackling the HONO puzzle, The ISME Journal, 13(7), 1688-1699.
[https://doi.org/10.1038/s41396-019-0379-y]

-
Xu, Z., Wang, T., Wu, J., Xue, L., Chan, J., Zha, Q., Zhou, S., Louie, P.K., Luk, C.W. (2015) Nitrous acid (HONO) in a polluted subtropical atmosphere: Seasonal variability, direct vehicle emissions and heterogeneous production at ground surface, Atmospheric Environment, 106, 100-109.
[https://doi.org/10.1016/j.atmosenv.2015.01.061]

-
Ye, C., Gao, H., Zhang, N., Zhou, X. (2016) Photolysis of nitric acid and nitrate on natural and artificial surfaces, Environmental Science & Technology, 50(7), 3530-3536.
[https://doi.org/10.1021/acs.est.5b05032]

-
Ye, C., Zhang, N., Gao, H., Zhou, X. (2017) Photolysis of Particulate Nitrate as a Source of HONO and NOx, Environmental Science & Technology, 51(12), 6849-6856.
[https://doi.org/10.1021/acs.est.7b00387]

-
Yu, Y., Galle, B., Panday, A., Hodson, E., Prinn, R., Wang, S. (2009) Observations of high rates of NO2-HONO conversion in the nocturnal atmospheric boundary layer in Kathmandu, Nepal, Atmospheric Chemistry and Physics, 9(17), 6401-6415.
[https://doi.org/10.5194/acp-9-6401-2009]

-
Zhang, W., Tong, S., Ge, M., An, J., Shi, Z., Hou, S., Xia, K., Qu, Y., Zhang, H., Chu, B., Sun, Y., He, H. (2019a) Variations and sources of nitrous acid (HONO) during a severe pollution episode in Beijing in winter 2016, Science of The Total Environment, 648, 253-262.
[https://doi.org/10.1016/j.scitotenv.2018.08.133]

-
Zhang, J., Chen, J., Xue, C., Chen, H., Zhang, Q., Liu, X., Mu, Y., Guo, Y., Wang, D., Chen, Y., Li, J., Qu, Y., An, J. (2019b) Impacts of six potential HONO sources on HOx budgets and SOA formation during a wintertime heavy haze period in the North China Plain. Science of The Total Environment, 681, 110-123.
[https://doi.org/10.1016/j.scitotenv.2019.05.100]

-
Zhang, Q., Liu, P., Wang, Y., George, C., Chen, T., Ma, S., Ren, Y., Mu, Y., Song, M., Herrmann, H., Mellouki, A., Chen, J., Yue, Y., Zhao, X., Wang, S., Zeng, Y. (2023) Unveiling the underestimated direct emissions of nitrous acid (HONO), Proceedings of the National Academy of Sciences, 120(35), e2302048120.
[https://doi.org/10.1073/pnas.2302048120]

-
Zhang, X., Tong, S., Jia, C., Zhang, W., Li, J., Wang, W., Sun, Y., Wang, X., Wang, L., Ji, D., Wang, L., Zhao, P., Tang, G., Xin, J., Li, A., Ge, M. (2022) The levels and sources of nitrous acid (HONO) in winter of Beijing and Sanmenxia, Journal of Geophysical Research: Atmospheres, 127(10), e2021JD036278.
[https://doi.org/10.1029/2021JD036278]

-
Zhou, X., He, Y., Huang, G., Thornberry, T.D., Carroll, M.A., Bertman, S.B. (2002) Photochemical production of nitrous acid on glass sample manifold surface, Geophysical Research Letters, 29(14), 26-1.
[https://doi.org/10.1029/2002GL015080]

-
Zhou, X., Gao, H., He, Y., Huang, G., Bertman, S.B., Civerolo, K., Schwab, J. (2003) Nitric acid photolysis on surfaces in low-NOx environments: Significant atmospheric implications, Geophysical Research Letters, 30(23).
[https://doi.org/10.1029/2003GL018620]

-
Zhou, X., Zhang, N., TerAvest, M., Tang, D., Hou, J., Bertman, S., Alghmand, M., Shepson, P.B., Carroll, M.A., Griffith, S., Dusanter, S., Stevens, P.S. (2011) Nitric acid photolysis on forest canopy surface as a source for tropospheric nitrous acid, Nature Geoscience, 4(7), 440-443.
[https://doi.org/10.1038/ngeo1164]

김나은 (한국표준과학연구원 가스분석표준그룹 학생연구원) (skdms5924@kriss.re.kr)
이혜연 (충남대학교 환경공학과 석사) (yeonii530@kriss.re.kr)
옥수민 (한국표준과학연구원 가스분석표준그룹 학생연구원) (sumin98@kriss.re.kr)
송미정 (전북대학교 지구환경과학과 교수) (mijung.song@jbnu.ac.kr)
이지이 (이화여자대학교 환경공학과 교수) (yijiyi@gmail.com)
안준영 (국립환경과학원 대기환경연구과 연구관) (nierair@korea.kr)
정진상 (한국표준과학연구원 가스분석표준그룹 책임연구원) (jsjung@kriss.re.kr)
