서울 대기 중 PM1.0의 계절별 화학조성 특성
 ; Ji Yi Lee1), *
Abstract
In this study, to characterize PM1.0 concentrations and chemical composition, seasonal PM1.0 samples were collected using a single channel particulate sampler equipped with PM1.0 cyclone and quantified the chemical compositions of PM1.0. The sampling of PM1.0 was carried out at the Seoul Metropolitan Area Air Pollution Research Center located at Bulgwang in Seoul. The 8 ions (Cl-, NO3-, SO42-, Na+, NH4+, K+, Ca2+, and Mg2+), organic carbon (OC), elemental carbon (EC), and 13 elements (As, Cd, Cu, Zn, Pb, Cr, Mn, Fe, Ni, K, V, Se, and Al) were analyzed in the PM1.0 samples. The annual average of PM1.0 mass concentration was 18±10 μg/m3 with the highest in winter as 30±9 μg/m3 and the lowest of 12±6 μg/m3 in fall. Among the chemical components of PM1.0, OC was the most dominating component, and variations of OC and SO42- were not significant, whereas NO3- and EC showed distinct seasonal variations, highest in winter and lowest in summer. The distributions of precursor gases, oxidation ratio, and meteorological data were used to characterize the difference in PM1.0 chemical composition between normal and heavy pollution periods. High PM1.0 concentrations in the spring were associated with increases in precursor gas concentrations, whereas in the winter, transport of PM1.0 could cause a significant effect on PM1.0 concentrations with chemical components.
Keywords:
PM1.0, Mass concentration, Chemical components, Seasonal variation1. 서 론
국내 수도권 지역에서의 미세먼지는 국내에서 자체 발생한 미세먼지와 더불어 국외로부터 장거리 이동한 미세먼지의 영향으로 인해 고농도로 관측되는 경우가 빈번하다 (Lee et al., 2021; Lee et al., 2011). 일반적으로 국외 미세먼지 영향은 연평균 30~50%, 고농도 사례에는 60~80%로 추정되고 있다 (NIER, 2017). 최근 국립환경과학원의 한중일 공동연구에 의하면, 우리나라 미세먼지 연평균 농도에 대한 국내 영향은 51.2%, 중국의 영향은 32.1%, 일본의 영향은 1.5%로 나타났다 (LTP project, 2019). 미세먼지가 고농도를 보일 때에는, 주로 이차무기이온들의 농도 및 비율이 높은 것으로 보고되고 있다 (NIER, 2018; Kim, 2017). 미세먼지는 입자 크기에 따라 공기역학적 직경 10 μm 이하는 PM10, 2.5 μm 이하는 PM2.5로 구분된다. 최근에는 입경 1 μm 이하인 PM1.0 (particulate matter equal to and less than 1.0 micrometers in aerodynamic diameter)의 유해성도 보고되고 있으나 (Chen et al., 2017; Singh and Gupta, 2016), 아직 관련 연구가 부족한 실정이다. PM1.0은 PM2.5보다 화석연료의 연소, 기체상 물질의 응축, 기체-입자 상변화에 의한 생성 영향을 더욱 크게 받는 것으로 알려져 있다 (Lundgren et al., 1996; Chow, 1995).
기존 국내의 PM1.0 화학조성에 관한 선행 연구는 대부분 TOF-AMS를 활용하여 측정한 논문들로 이루어져 있다 (Park et al., 2018a; Choi et al., 2016a; Kim et al., 2016; Park et al., 2015a; Park et al., 2015b; Kim et al., 2014; Choi et al., 2013). 입자상 물질의 화학조성을 분석하는 대기오염공정시험법의 기준은 현재까지 필터포집법에 의한 화학성분을 분석하는 방법을 채택하고 있다. 반면, 본 연구와 같이 필터포집법을 이용한 PM1.0 화학조성 연구는 제한적으로 발표되었고, Lim et al. (2011)에서는 PM1.0 사이클론을 이용하여 PM1.0를 필터포집하였고, 탄소 성분과 이온 성분을 분석하였다. 그 외 중금속을 분석한 논문은 다단입자채취기를 이용하여 PM1.0과 그 이하 입경별 중금속을 분석한 논문들을 발표하였다 (Han et al., 2019; Cho et al., 2010). 따라서, PM1.0 화학조성 연구를 중량농도법에 준하여 진행하게 되면, 추후 PM2.5 화학조성 결과와 직접비교가 가능하고, 실시간 측정장비인 TOF-AMS의 PM1.0 화학조성 결과와 비교분석이 가능하다는 장점이 있다.
수도권 지역의 PM2.5는 이차 생성 입자들이 50% 이상의 높은 비율을 차지하며, 이는 주로 황산염과 질산염, 암모늄과 같은 이차 무기염으로 구성되어 있다 (NIER, 2018; Kim, 2017). 기존 연구에 따르면 황산이온과 질산이온의 입경분포 특성은 입자 사이즈 1 μm를 기준으로 황산이온의 경우 계절에 상관없이 1 μm 이하 영역에서 우세하나, 질산이온의 경우 대체로 1 μm 이상 영역에서 우세하며 봄과 겨울에는 1 μm 이하 영역에서 높게 나타나는 등 계절별로 상이한 크기분포를 가지는 것으로 밝혀졌다 (Feng et al., 2019; Li et al., 2013; Zhang et al., 2008). 따라서, 향후 미세먼지에 의한 환경학적 영향을 파악하고, 미세먼지의 생성과 성장원인을 규명하기 위해서는 이차생성의 주요 입경영역인 PM1.0의 물리, 화학적 특성을 파악하는 것이 중요하다. 본 연구에서는 수도권 지역의 2019년 1년간 계절 변화에 따른 PM1.0의 질량농도와 화학조성에 대하여 파악하고, 고농도의 PM이 발생했을 시의 PM1.0의 특성을 살펴보았다.
2. 실험 방법
2. 1 시료 채취 지점 및 기간
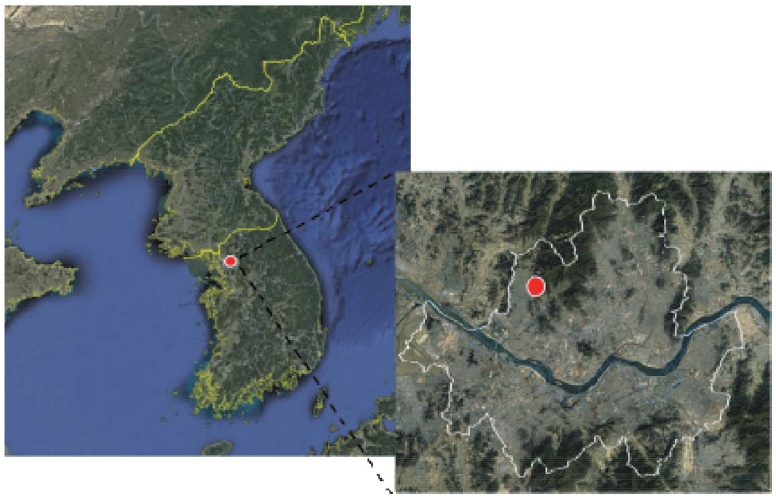
본 연구에서는 서울시 은평구 불광동에 위치한 국립환경과학원 수도권 대기환경연구소 (37°61′N, 126°93′E)에서 PM1.0 시료 채취를 직접 진행하였다. 그림 1에서 보이는 바와 같이 수도권 대기환경연구소는 주변에 대규모 대기오염 배출시설이 없고 북쪽으로는 북한산이 위치하며, 서쪽으로는 대규모 주거 단지가 있다. 측정 기간은 표 1과 같이 2019년 5월 17일부터 2020년 1월 4일까지 계절별로 집중측정기간을 약 2주간 설정하여 일별 23시간 동안 채취하였다.
2. 2 시료 채취 방법
본 연구에서는 PM1.0의 시료 채취를 대기오염공정시험법에 제시된 대기 중 PM2.5의 시료 채취방법 (NIER, 2017)에 준하여 진행하였다. PM1.0 사이클론은 US EPA (US EPA, 1999)에서 제시한 PM2.5 사이클론 조건에 준하는 PM1.0 사이클론을 사용하였고 (Sharp Cut Cyclone, E-FRM-230 (Met One, USA), 유량계에 MFC (Mass Flow Controller)를 장착하여 유량의 오차범위를 2% 이내로 조절하였다. 본 연구에서는 이온 및 중금속 성분 분석용과 탄소 성분 분석용 시료를 별도로 채취하기 위해 두 대의 PM1.0 채취기를 가동하였다. 탄소 성분을 분석하기 위하여 석영 필터 (Quartz filter, Pall, 47 mm)를 장착하여 시료를 포집하였고, 이온 및 중금속 성분 분석을 위해 테플론 필터 (Teflon filter, MTL, 2 μm, 47 mm)를 사용하였다. 석영 필터의 경우 시료 채취 전에 550°C에서 12시간 가열하여 필터 내 불순물을 제거하였다. 계절마다 최소 6개의 현장 바탕 시료를 이용하여 이온성분과 탄소 성분, 질량농도에 대하여 각각 보정을 진행하였다.
2. 3 PM1.0 질량농도 측정 방법
PM1.0 질량농도를 측정하기 위하여 PM1.0 시료를 채취한 전후 24시간 동안 데시케이터에서 건조하였고, 칭량은 XP2U (Mettler toledo, USA)와 AH500E system (MTL, USA)의 자동 필터칭량시스템을 이용하였다. 시료 채취 전후에 시료 무게를 칭량 시 바탕시료 필터의 무게도 동시에 칭량하여, 대기조건 및 운반 과정에서 발생하는 PM1.0 농도의 오차를 보정하였다. 사용된 저울은 0.1 μg의 해독도를 가진다.
2. 4 PM1.0 내 이온성분 분석 방법
PM1.0 내 이온 성분의 분석을 위해 테플론 필터 시료의 반을 용출병에 넣고 증류수 15 mL를 주입하였다. 그런 다음, 용출병을 2시간 동안 25~30°C에서 초음파 추출기 (Ultra Sonic Cleaner, Power Sonic 520, Hwashin Tech, South Korea)를 이용하여 추출하였다. 용출액은 실린지 필터로 여과하였다. 이온크로마토그래프 (Ion Chromatograph: IC, 925 Eco IC, Metrohm, Switzerland)를 이용하여 여과액 내 양이온 5종 (Na+, K+, Ca2+, Mg2+, NH4+)과 음이온 3종 (Cl-, NO3-, SO42-)을 분석하였다. 이때 사용된 IC 분석조건은 표 2와 같다. 표준시료를 이용한 개별 성분에 대한 검량선의 r2은 0.99 이상임을 확인하였고, 계절별 시료 분석을 진행했으며 시료 분석 전 매번 calibration을 진행하였다. 시료 분석 시 현장 바탕시료 분석 결과를 (표 3) PM1.0 시료 최종농도 결과에 보정하여 최종 PM1.0 내 화학성분 농도를 산정하였다. 검출 가능한 최저농도 표준용액을 7회 반복 분석하여 얻은 농도의 표준편차에 3.14를 곱하여 방법검출한계 (Method Detection Limit: MDL)를 산출하였다 (표 4).
2. 5 탄소 성분 분석 방법
PM1.0내 탄소 성분 (OC, EC)을 분석하기 위해 NIOSH (National Institute of Occupational Safety and Health) 5040에 의한 TOT (Thermal Optical Transmittance) 방법으로 OCEC 분석장비 (Model-5L, Sunset, USA)를 이용하여 분석하였다. 15개 시료 분석마다 정량의 자당 (sucrose) 성분으로 OC 농도를 비교하여 분석 정확도를 확인하였고, 5% 이내의 오차범위를 허용하였다. 본 연구에서는 대기 중 OC와 EC 농도 산정 시, Sunset의 인증시료 (Performance Evaluation Sample, Sunset사)를 구입하여 OC와 EC 분석의 정확성 및 정밀성 평가를 실시하였다. Sunset사의 인증 시료를 분석한 결과, TC와 OC, EC 모두 정확성이 2% 내외로 유사한 결과를 나타내는 것을 확인하였다 (표 5).
3. 결과 및 고찰
3. 1 계절별 PM1.0 질량농도 분포 특성
2019년 봄의 PM1.0 평균 농도는 19±12 μg/m3이었고, 여름에는 봄보다 약 5 μg/m3 낮은 14±6 μg/m3이었다. 가을에 PM1.0 평균 농도는 12±6 μg/m3으로 네 계절 중 가장 낮았다. 겨울 측정 기간에는 평균 30±9 μg/m3으로, 네 계절 중 가장 높은 농도를 보였다. 본 연구에서 측정한 2019년 PM1.0 측정기간 전체 평균 농도는 18±10 μg/m3이었고, 이는 우리나라 PM2.5 연평균 기준인 15 μg/m3을 초과하는 수치였다. 동일한 시료 채취장소에서 진행된 AMS를 통한 PM1.0 연구 (Park et al., 2018b)에서는 2013년부터 2015년까지의 NR-PM1.0 (Non-refractory fine particle)의 월평균 농도는 7.1~35.9 μg/m3으로 나타났다. 각각의 연평균농도는 9.7 μg/m3, 9.9 μg/m3, 24.0 μg/m3으로 2019년의 연평균은 2015년보다는 낮지만 2013년과 2014년보다는 높게 나타났다.
본 연구에서 측정한 PM1.0의 질량농도를 동일 기간에 베타선법에 의해 측정된 PM2.5의 질량농도와 비교하였다. PM2.5 질량농도 자료는 한 시간 단위의 측정 결과로, 23시간 동안 측정한 PM1.0의 질량농도와 비교하기 위하여 PM1.0의 시료 채취시간 동안의 PM2.5 질량농도를 평균 내어 그림 2에 나타내었고, PM1.0과 PM2.5의 상관계수 (r)는 0.92에서 0.99로 높은 상관성을 보였다. 이를 통해 모든 계절에서 서울의 PM1.0의 질량농도 변동성은 PM2.5의 질량농도 변동성과 매우 유사함을 알 수 있었고, 이는 PM1.0가 PM2.5 발생 특성과 유사할 수 있음을 의미한다. 시료 채취기간과 동일한 기간에 베타선법으로 측정한 PM2.5 연평균은 25±14 μg/m3이었으며, 본 연구에서 측정한 PM1.0의 평균 농도의 약 1.4배에 달하는 수준이다. 계절별 PM1.0과 PM2.5의 농도 수준과 PM1.0/PM2.5의 비율을 표 6에 나타내었다. PM2.5 내 PM1.0의 비율은 계절에 따라 차이를 보였는데, 가을에 가장 낮고 여름에 가장 높았다. 대기 중 PM2.5 내 PM1.0의 비율이 낮고, 상대적으로 PM1.0-2.5의 비율이 증가하는 이유 중 하나는 토양기원의 먼지의 영향이 높아졌을 때로 평가된다 (Roemer et al., 2001; Lundgren et al., 1996). 따라서, 본 연구에서 가을철 PM1.0/PM2.5의 비율이 낮아진 것은 토양기원의 영향이 높아졌기 때문으로 예상된다. 반면, 여름철과 겨을철 PM1.0의 비율이 높은 것은 광화학반응과 연소배출에 의한 영향의 증가로 사료된다.
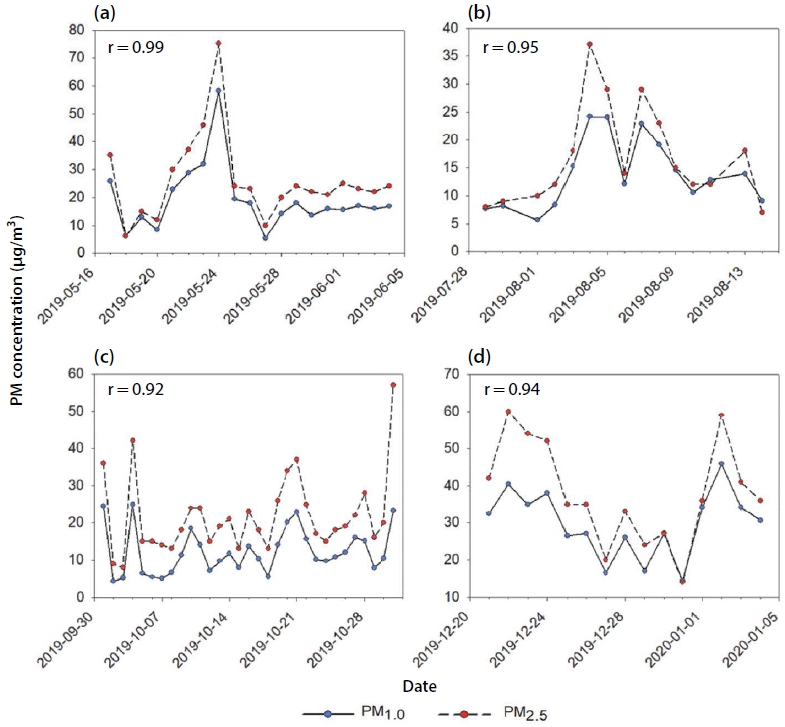
Correlation coefficient (r) indicates the correlation between PM1.0 and PM2.5 mass concentration at each season (a) spring, (b) summer, (c) fall, and (d) winter.
3. 2 계절별 PM1.0 화학조성 특성
계절별 PM1.0의 성분 분포를 전체 기간 동안의 평균 분포와 함께 그림 3에 나타내었다. 이때 원의 크기는 각 계절의 PM1.0 전체 질량농도에 비례하게 나타내었다. Elements는 울산과학기술원에서 측정 분석한 중금속 12종 (As, Cd, Cu, Zn, Pb, Cr, Mn, Fe, Ni, V, Se, Al)을 합하여 나타낸 값이다. Crustal ions and others는 Ca2+와 Mg2+와 같이 PM1.0 질량 내 분율이 낮은 토양기원의 이온들과 PM1.0 질량에서 분석 가능한 물질을 제외한 부분을 함께 나타내었다. 전체 기간의 OC 평균 농도는 5.3±2.7 μg/m3으로 PM1.0 질량농도의 31.5%로 가장 높게 나타났다. 이어서 SO42-가 21.5%이며 NO3-는 11.7%, NH4+는 11.5%로 이차 무기 이온인 세 성분의 합은 전체의 44.7%를 차지했다. 기존 서울의 PM2.5의 연구 결과 (Park et al., 2020; Bae et al., 2019)에서는 상대적으로 기온이 낮은 봄과 겨울에 NO3-가 SO42-에 비해 높게 나타났다. 본 연구에서도 겨울에 PM1.0 내 NO3-가 가장 높은 비율을 차지하였지만, 겨울을 제외한 다른 계절에서는 OC가 가장 높았으며, SO42-가 다음으로 높은 비율을 보였다.
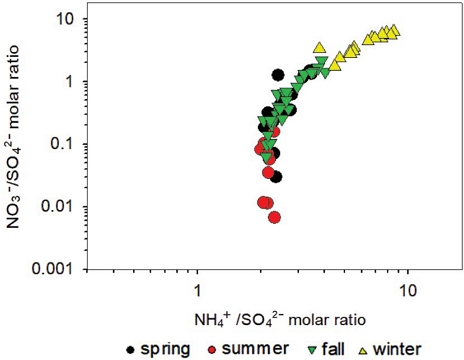
SO42-는 계절별로 비율에서는 차이가 나타났으나 가을을 제외하고는 계절별 평균 질량농도는 3.77~4.75 μg/m3으로 유사한 수준으로 나타났다. 반면 NO3-의 경우에는 겨울에 가장 높은 농도를 보이고, 여름에는 매우 낮은 특징을 보였는데, 이는 기존에 PM2.5의 화학조성 연구 (Kim et al., 2008; Russell et al., 1983)에서 보고되어온 것처럼 여름철의 높은 온도에 따른 NH4NO3의 휘발으로 인한 영향으로 판단된다. TOF-AMS를 이용하여 서울과 백령도의 월별 PM1.0의 화학조성을 파악한 선행 연구 (Choi et al., 2016)에서도 본 연구와 유사하게 겨울철 NO3- 농도와 비율이 다른 계절들에 비해 증가하는 경향성을 보였다. 또한, Feng et al. (2019)에 따르면 SO42-와는 달리 NO3-는 계절별 입경분포가 다르게 나타났다. 봄, 여름, 가을에서는 NO3-는 주로 1.0~2.5 μm의 입자 영역에서 우세한 농도를 보이는 반면, 겨울에는 1.0 μm보다 작은 영역에서 농도가 높았다. 계절에 큰 영향을 받지 않고 PM1.0 이하의 영역에서 높은 분포를 보이는 SO42-와 NH4+와 달리 NO3-의 경우 계절에 따라 주요하게 분포하는 입자 크기 영역이 다르다는 기존의 연구들 (Feng et al., 2019; Li et al., 2013; Zhuang et al., 1999)에 따라 계절 변화의 영향을 받았을 것으로 해석된다. NO3-와 SO42-의 몰 비와 NH4+와 SO42-의 몰 비를 통해 기존 연구 (Huang et al., 2011)와 같이 암모늄과 황산이온의 몰 비가 계절에 상관없이 1.5 이상으로 암모늄이 풍부한 조건이었음을 확인하였다.
PM1.0의 주요성분들 간의 상관분석을 진행한 결과 여름을 제외한 모든 계절에서 성분 간 상관성이 높게 나타났다 (표 7). 여름의 경우 각 성분 간의 상관성이 낮은 이유는 기존의 선행 연구 (Russell et al., 1983)에서 알려진 바와 같이 30°C 이상에서 대기 중의 NO3-는 주로 가스상의 HNO3로 존재하며 이는 여름철 많은 일사량과 높은 기온으로 인하여 입자상의 NO3-로 존재하지 않아 다른 계절에 비하여 여름철 성분 간 낮은 상관관계에 영향을 준 것으로 해석되어진다. 겨울에는 특히 NH4+와 NO3-가 가장 높은 상관성을 보였는데 이는 앞에서 설명한 바와 같이 겨울철 NO3- 농도는 다른 계절에 비해 가장 높았고, 이차 생성된 NO3-는 주로 질산염 (NH4NO3) 형태로 존재하기 때문으로 판단된다.
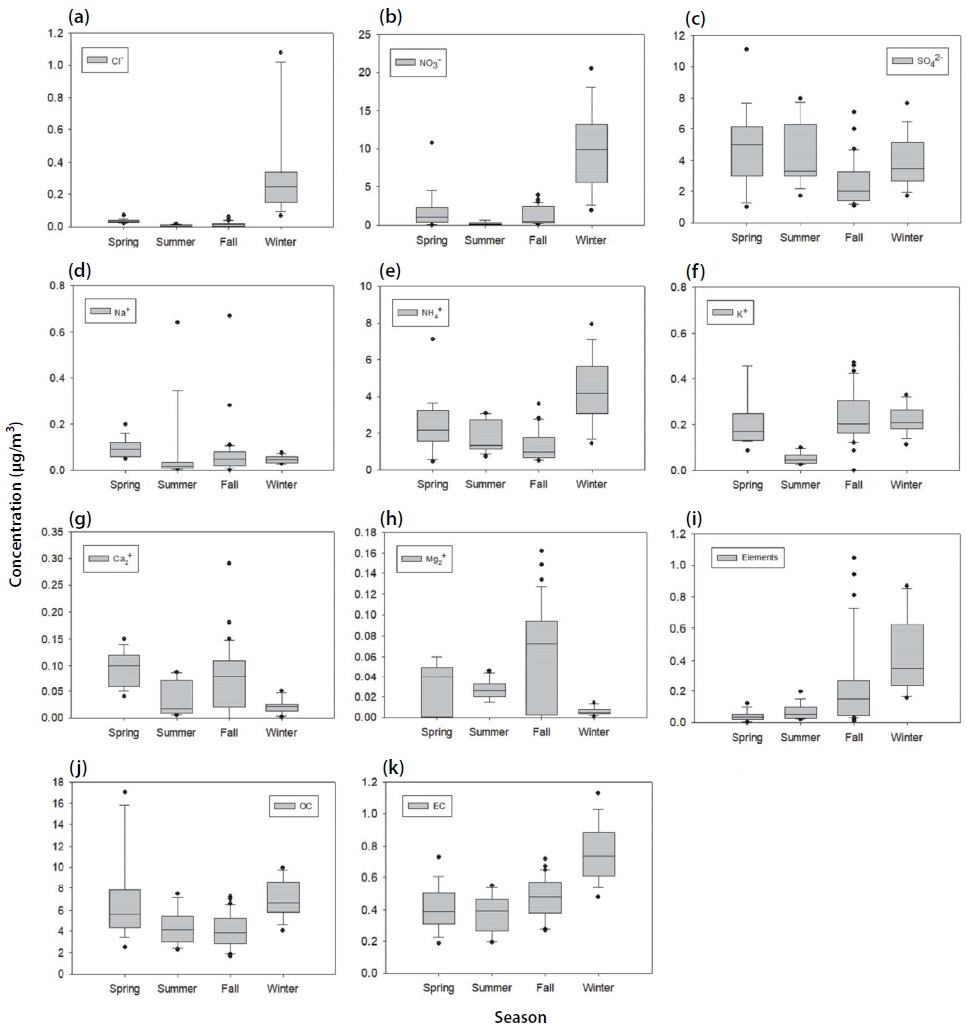
그림 5에 PM1.0 내 모든 화학성분들에 대한 계절별 농도분포를 나타내었다. 토양침식, 토양 재부유로 인한 토양기원이며 조대입자에서 우세한 비율로 존재하는 것으로 알려진 Ca2+와 Mg2+ 농도는 (Perrone et al., 2010) 봄과 가을에 각각 4.0배와 3.1배로 두드러지게 높았다. 따라서 봄과 가을철 PM1.0은 토양기원의 영향이 타 계절에 비하여 상대적으로 강하였던 것으로 판단된다.
K+는 계절별 농도 수준이 유사하였지만, 가을철 상대적으로 낮은 PM1.0의 질량농도로 인하여 K+이 PM1.0에서 차지하는 비율은 약 2.3%로 봄 (1.2%)과 여름과 겨울 (0.4%, 0.8%)보다 컸다. K+는 일반적으로 해상기원과 토양기원, 생체연소의 여러 배출 기원을 가진다 (Zhang et al., 2008; Andreae et al., 1998). 조대입자에서는 해상과 토양의 영향을 많이 받으며, 1.0 μm 이하의 영역에서는 생체연소의 영향이 지배적으로 알려져 있다 (Parmar et al., 2001; Meszaros et al., 1997). 3.1절에서 언급한 바와 같이 가을철 PM1.0/PM2.5의 비율이 가장 낮았고, OC와 K+의 상관관계를 파악한 결과 가을철에 OC와의 상관성이 봄과 겨울에 비해 낮았다 (봄: 0.60, 겨울: 0.87). 따라서 가을철 PM1.0에서의 K+ 비율의 증가는 생체연소의 영향보다는 토양기원의 자연적 발생원의 영향이 증가한 것으로 해석되어진다.
Cl-는 겨울에 평균 0.3±0.3 μg/m3으로 다른 계절에 비해 약 6~30배 높았다. Cl-의 경우 조대입자의 영역에서는 해양기원에 의한 영향이 크나, 미세입자의 경우 일반적으로 Cl- 농도의 증가는 산업공정이나 소각 및 석탄 연소의 영향 (EMEP, 2019; Zhao and Gao, 2008)으로 알려져 있다. 따라서 본 연구 기간의 겨울철은 난방으로 인한 석탄 연소의 영향이 클 것으로 예상된다.
3. 3 기체전구물질과 이차무기이온 간의 상관성
대기 중 산화정도를 나타내는 지표로 사용되는 Nitrogen Oxidation Ratio (NOR)은 기체전구물질인 NO2와 이차무기이온인 NO3-의 아래의 식과 같이 몰농도를 통해 계산한다 (Sun et al., 2006).
| (1) |
높은 NOR은 대기 중 기체전구물질이 쉽게 산화되는 상태를 의미한다 (Sun et al., 2006). 그림 6에 NOR을 일별로 나타내었고, NO2 농도는 에어코리아에서 제공하는 은평구 측정소의 시간 단위 자료를 일 단위로 평균하여 사용하였다 (https://www.airkorea.or.kr/web/pastSearch).
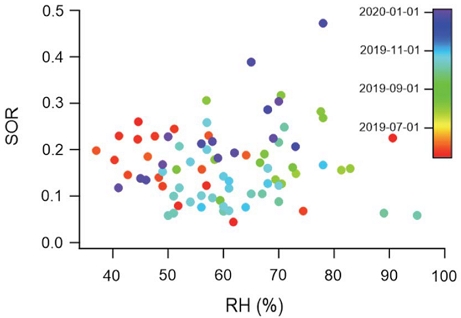
NOR이 0.1 이하의 값을 나타낼 때, 일차 배출원에 의한 영향에 의한 것으로 알려져 있다 (Ohta and Okita, 1990). 본 연구 기간 동안 NOR은 대체적으로 낮은 값을 나타내며 이는 NO3-이 국지적 영향에 의해 주로 생성되었음을 알 수 있다 (Kaneyasu et al., 1995). 일별로 전체 연구 기간에 대하여 oxidation ratio와 상대습도 간 연관성을 보았을 때, 계절별로 기울기에 차이는 있으나, 여름을 제외한 봄, 가을, 겨울에서 NOR가 상대습도와 함께 증가하는 추세를 보였다. 30°C 이상에서 대기 중의 NO3-는 주로 가스상의 HNO3로 존재하는데, 해당 연구 기간 중 여름의 평균 기온은 29.2°C인 높은 온도로 인하여 입자상 NO3-가 낮아 다음과 같은 결과가 나타났을 것으로 추정된다 (그림 7).
3. 4 고농도 사례 분석
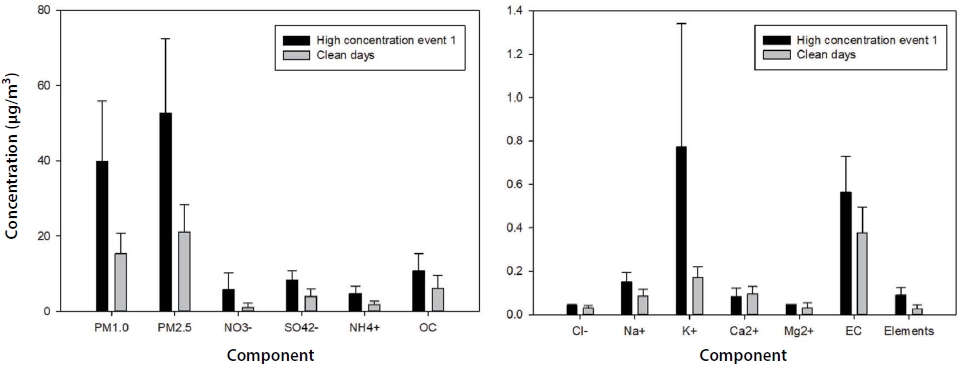
본 연구에서는 PM2.5의 대기환경기준인 35 μg/m3을 초과한 날을 고농도 사례로 분류하였고, 특히, 연구 기간 중 3일 이상 연속으로 PM2.5의 질량농도가 35 μg/m3을 초과한 날에 대하여 분석을 진행하였다. 3일 이상 연속으로 PM2.5의 질량농도가 35 μg/m3을 초과한 날들은 봄철과 겨울철에 나타났으며 해당 기간의 기상 자료와 함께 표 6에 나타내었다. 봄철에는 2019년 5월 22일부터 24일까지 PM2.5 농도가 35 μg/m3을 초과하였으므로 해당 날짜를 봄철 고농도 사례 1로 구분하여 다른 날과 비교하였다. 고농도 사례 1 기간인 5월 24일 국내 PM1.0과 PM2.5 농도가 증가하였고, NO3-와 SO42-, NH4+, OC, EC의 농도도 함께 증가하였다. 특히 NO3-와 생물 연소에서 배출되는 K+의 농도가 평상시보다 약 5배 증가하였다 (그림 8).
고농도 기간에 대한 공기궤 이동 특성을 파악하기 위하여, NOAA에서 제공하는 Hybrid Single-Particle Lagrangian Integrated Trajectory (HYSPLIT) 모델을 이용하였다. 72시간 동안의 역궤적을 파악하였으며, 지표와의 저항 효과를 제외하기 위하여 도착지점의 고도는 해발 500 m로 지정하였다. 공기궤들은 주로 중국의 남동부에서 유입된 후 대기정체 현상이 발생하였다 (그림 9).
더불어 이 시기의 NASA/NOAA Suomi-National Polar orbiting Partnership (S-NPP) 위성에 탑재된 Visible Infared Imaging Radiometer Suite (VIIRS) 장비를 통하여 공기궤가 유입한 지역들에서 자외선을 이용하여 이미징한 것으로 활성 화재나 화산, 가스 플레어와 같은 열 이상 징후를 확인하였다. 따라서 지도에 나타난 것을 통하여 중국 남동부에서 생물성 연소가 발생한 것을 예측할 수 있다 (그림 10).

Fire events during (a) May 22, (b) May 23, and (c) May 24 observed by NASA/NOAA Suomi-National Polar orbiting Partnership (S-NPP).
봄철 고농도 사례에는 SO42-의 전구물질인 SO2의 증가로 인하여 높은 수준의 SO42-을 보였고 이는 봄철 고농도 기간의 SO42-의 증가는 기체전구물질인 SO2의 증가와 봄철의 저농도 기간보다 낮은 상대습도로 인한 가스상 반응이 활발하게 일어났기 때문으로 보여진다 (표 8, 9). 이를 통하여 봄철 고농도 사례의 원인은 중국 남동부지역에서의 생체연소의 발생 후 국내 유입과 더불어 공기 정체에 의한 대기오염물질의 축적인 것으로 추정된다.
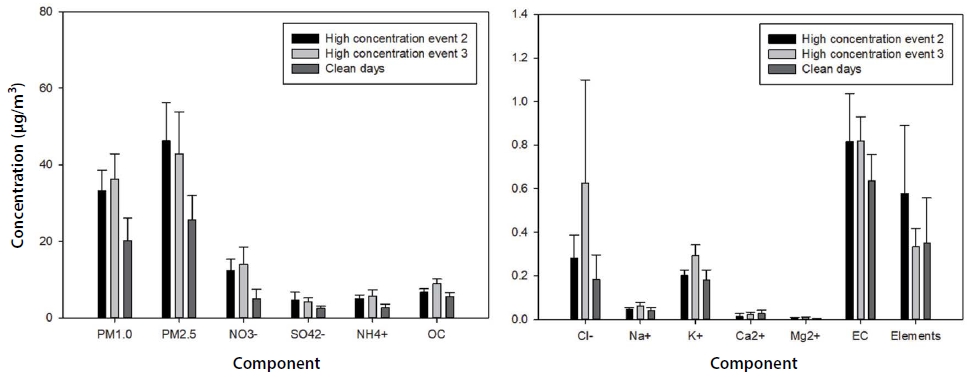
겨울 측정기간 동안 PM2.5 농도가 35 μg/m3을 초과한 날은 2019년 12월 21일부터 25일까지의 5일 (고농도 사례 2)과, 2020년 1월 1일부터 4일까지 4일 (고농도 사례 3)이었다. 고농도 사례 2의 PM1.0 농도는 평상시에 비해 약 1.6배 증가하였고, NO3-와 SO42-, NH4+, Cl- 농도는 각 2.6배, 1.8배, 1.9배, 1.5배 증가하였다 (그림 11). 고농도 사례 3 기간에 PM1.0 농도는 평상시의 약 1.7배 증가하였고, NO3-와 SO42-, NH4+ 농도는 각 2.6배, 1.6배, 2.1배 증가하였으며, 특히, Cl-의 농도가 평상시의 3.3배로 두드러지게 증가하였다. 봄철 고농도 사례 1과 겨울철 고농도 사례 2에서는 Cl-의 농도는 증가하지 않았다. 고농도 사례 3의 경우는 Cl-농도가 높았던 것으로 보아 해당 기간에 석탄 연소 등 난방에 의한 영향이 컸음을 추정할 수 있다. 겨울철의 두 차례의 고농도 사례에 대한 공기궤 이동 특성을 파악한 결과, 공기궤들은 주로 몽골의 동부지역을 거쳐 중국의 북동부에서 유입되었고, 서울에서 대기 정체 현상이 동시에 발생하였다 (그림 12).
봄과 겨울 모두 저농도 기간보다 고농도 사례에 유의미하게 낮은 풍속으로 대기 정체가 이루어졌다. 반면 겨울철 고농도 사례는 봄철과 비교하였을 때, 높은 상대습도가 나타난 것을 확인할 수 있다 (표 9). 또한, 고농도 사례 기간의 역궤적은 모두 중국 동북부 지역의 영향을 받았을 것으로 보이나, 풍향은 고농도 사례와 관계없이 봄에는 서풍을, 겨울에는 북동풍 계열이 우세했음을 확인하였다. 하지만, 고농도 사례 2의 경우 공기궤가 짧은 거리에서 이동해 온 기간이 포함된 반면에, 고농도 사례 3의 경우 고농도 기간 내 모두 공기궤의 이동거리가 길었다.
겨울철 고농도 사례 2에서는 평상시보다 전구물질인 SO2는 더 낮았고 사례 3에서는 유사한 수준을 보였으나 SO42-의 농도가 높았고 이는 대기 중 산화가 되기 쉬운 환경이거나 장거리 이동에 영향을 받았을 것으로 고농도의 이차 무기염을 형성하는 것에 기여하였다 (표 10).
겨울철이 봄철에 비하여 평상시와 고농도 사례 모두 NO3-의 증가가 뚜렷하게 나타났다. NO3-는 봄과 겨울 모두 전구물질인 NO2가 고농도 사례에 증가하였다. 전구물질인 NO2의 농도는 봄철이 더 높게 나타났으나, 겨울과 관계없이 유사한 수준으로 증가하였으나, 전반적인 NO3- 농도는 겨울철에 높게 나타났다. 이를 통해 봄 계절철 고농도 사례는 기체전구물질의 증가로 인한 NO3-의 농도 증가가 주된 요인이며, 겨울철 고농도 사례에서 질산염 농도 증가는 봄철에 비해 겨울철 대기 온도가 낮아짐에 따라 질산염으로의 상분배가 증가한 요인과 더불어 고농도 시기의 높은 상대습도로 인한 비균질반응의 증가, 장거리 이동 등의 기류 이동에 의하여 이차무기성분들의 농도가 증가한 것으로 사료된다.
4. 요약 및 결론
본 연구 기간의 서울의 연평균 PM1.0 농도는 18±10 μg/m3이었고, 이는 우리나라 PM2.5 연평균 기준인 15 μg/m3을 초과하는 수치였다. PM1.0은 겨울>봄>여름>가을 순으로 높았으며, 계절 변화에 따른 OC와 SO42-의 농도는 유사했으나, 질량농도의 차이로 인한 PM1.0 내 비율의 차이가 나타났다. NO3-의 경우 여름에 매우 낮으며 겨울에 가장 높게 측정되었고, 이는 대기 온도와 함께 NO3-의 계절에 따른 입경분포의 변화와 관련이 있는 것으로 판단된다.
NO2는 계절별, 일별 농도변화가 뚜렷하였고, 기체전구물질인 NO2의 대기 체류시간은 일반적으로 1시간에서 8시간 정도로 짧아 (Liu et al., 2016) 국내에서 배출된 NO2의 변동이 NO3-의 농도변화에 영향을 주었을 것으로 해석된다.
시료 채취 기간 중 일평균 PM2.5 농도가 35 μg/m3을 3일 이상 초과한 고농도 사례는 봄철과 겨울철에 발생하였다. 봄철과 겨울철 고농도 기간에 성분별 농도 증가 경향과 기상 특성, 역궤적 분석을 해석하여 고농도 원인을 파악하였다. 봄철 고농도 사례에는 OC, SO42-와 K+가 급증하였고, NO3-, SO42-의 전구물질인 NO2와 SO2의 농도 역시 증가하였다. 따라서, 고농도 사례 1의 원인은 기체전구물질의 증가와 더불어 중국 남동부지역에서의 생체연소의 발생 후 국내 유입과 더불어 공기 정체에 의한 대기오염물질의 축적인 것으로 추정된다. 고농도 사례 2와 3에서는 모두에는 NO3-, SO42-, NH4+가 급증하였다. 특히, 고농도 사례 3에서는 Cl-의 농도가 두드러지게 증가하였는데, 이는 난방으로 인한 석탄 연소의 영향으로 해석되어진다. 겨울 두 차례의 고동도 사례에서는 중국 북동부 지역으로부터의 장거리 이동과 더불어 지역 배출에 의한 국지적 요인과 대기 온도가 낮아짐에 따라 질산염으로의 상분배가 증가한 요인과 더불어 고농도 시기의 높은 상대습도로 인한 비균질반응의 증가와 같은 이차 생성 및 축적 현상에 의한 것으로 추정된다.
Acknowledgments
이 연구는 국립환경과학원의 수도권지역 PM1 특성 및 관리방안 (I) 과제 (NIER-SP2019-265)의 지원을 받아 작성되었습니다.
References
-
Aiken, A.C., Decarlo, P.F., Kroll, J.H., Worsnop, D.R., Huffman, J.A., Docherty, K.S., Ulbrich, I.M., Mohr, C., Kimmel, J.R., Sueper, D., Sun, Y., Zhang, Q., Trimborn, A., Northway, M., Ziemann, P.J., Canagaratna, M.R., Onasch, T.B., Alfarra, M.R., Prevot, A.S.H., Dommen, J., Duplissy, J., Metzger, A., Baltensperger, U., Jimenez, J.L. (2008) O/C and OM/OC ratios of primary, secondary, and ambient organic aerosols with high-resolution time-of-flight aerosol mass spectrometry, Environmental Science & Technology, 42, 4478-448.
[https://doi.org/10.1021/es703009q]

-
Andreae, M.O., Andreae, T.W., Annegarn, H., Beer, J., Cachier, H., Le Canut, P., Elbert, W., Maehaut, W., Salma, I., Wienhold, F.G., Zenker, T. (1998) Airborne studies of aerosol emissions from savanna fires in southern Africa: 2. Aerosol chemical composition, Journal of Geophysical Research-Atmosphere, 103, 32119-32128.
[https://doi.org/10.1029/98JD02280]

-
Bae, C.-H., Kim, B.-U., Kim, H.-C., Yoo, C., Kim, S.-T. (2019) Long-range transport influence on key chemical components of PM2.5 in the Seoul metropolitan area, South Korea, during the years 2012-2016, Atmosphere, 11(1), 48.
[https://doi.org/10.3390/atmos11010048]

-
Buczyńska, A.J., Krata, A., Grieken, R.V., Brown, A., Polezer, G., Wael, K.D., Vermaak, S.P. (2014) Composition of PM2.5 and PM1 on high and low pollution events days and its relation to indoor air quality in a home for the elderly, Science of The Total Environment, 490(15), 134-143.
[https://doi.org/10.1016/j.scitotenv.2014.04.102]

-
Charlson, R., Langner, J., Rodhe, H. (1990) Sulphate aerosol and climate, Nature, 348, 22.
[https://doi.org/10.1038/348022a0]

-
Chen, G., Li, S., Zhang, Y., Zhang, W., Li, D., Wei, X., He, Y., Bell, M.L., Williams, G., Marks, G.B., Jalaudin, B., Abramson, M.J., Guo, Y. (2017) Effects of ambient PM1 air pollution on daily emergency hospital visits in China: an epidemiological study, The Lancet Planetary Health, 1(6), 221-229.
[https://doi.org/10.1016/S2542-5196(17)30100-6]

-
Cho, T.-J., Jeon, H.-R., Youn, H.-S., Lee, M.-Y., Son, B.-S. (2010) A study on the size of ultrafine particles and heavy metal concentrations in the atmosphere, Journal of Environmental Health Sciences, 36(6), 280-295.
[https://doi.org/10.5668/JEHS.2010.36.6.480]

- Choi, J.-S., Kim, J.-H., Ahn, J.-Y., Park, J.-S., Koo, Y.-S., Yoon, G.-H., Kim, S.-D. (2013). A case study on the high mass loading aerosol observed using an aerodyne ToF-AMS in Baegryung Island, may 2011, Journal of the Korean Society of Urban Environment, 13(1), 19-32. https://www.earticle.net/Article/A203017
-
Choi, J.-S., Kim, J.-H., Lee, T.-H., Choi, Y.-J., Park, T.-H., Ahn, J.-Y., Park, J.-S., Kim, H.-J., Koo, Y.-S., Kim, S.-D., Hong, Y.-D., Hong, J.-H. (2016a) A study on chemical characteristics of aerosol composition at west inflow regions in Korean Peninsula II. Characteristics of inorganic aerosol acidity and organic aerosol oxidation, Journal of Korean Society for Atmosphere Environment, 32(5), 485-500.
[https://doi.org/10.5572/KOSAE.2016.32.5.485]

-
Chow, J.C. (1995) Measurement methods to determine compliance with ambient air quality standards for suspended particles, Journal of Air & Waste Management Association, 45, 320-382.
[https://doi.org/10.1080/10473289.1995.10467369]

-
Donaldson, K., Stone, V., Clouter, A., Renwick, L., MacNee, W. (2001) Ultrafine particles, Occupational & Environmental Medicine, 58(3), 211-216.
[https://doi.org/10.1136/oem.58.3.211]

- European Monitoring and Evalution Programme European Envrionment Agency (2019) EMEP/EEA air pollutants emission inventory guidebook.
-
Feng, J., Fengxian, L., Qinhao, L., Yuzhen, F., Yuxiang, Y., Long, P., Xiufeng, L., Guohua, Z., Xinhui, B., Xinming, W., Guoying, S. (2019) Characteristics and formation mechanisms of sulfate and nitrate in size-segregated atmospheric particles from urban Guangzhou, China, Aerosol and Air Quality Research, 19, 1284-1293.
[https://doi.org/10.4209/aaqr.2018.07.0251]

-
Ham, J.-Y., Lee, H.-J., Cha, J.-W., Ryoo, S.-B. (2007) Potential source of PM10, PM2.5, and OC and EC in Seoul during spring 2016, Atmosphere Korean Meteorological Society, 27, 41-54.
[https://doi.org/10.14191/Atmos.2017.27.1.041]

-
Han, Y.-D., Son, B.-S., Oh, Y.-J., Yoon, J.-S., Park, M.-K., Kim, K.-R., Cho, S.-J., Eo, S.-M., Shin, Y.-S., Park, M.-K., Im, J.-Y. (2019) Concentration of fine and ultrafine particulate matter (PM10 and PM1.0) and heavy metal in indoor air in some parts of Korea, Journal of Odor and Indoor Environment, 18(4), 321-329.
[https://doi.org/10.15250/joie.2019.18.4.321]

-
Hand, J.L., Schichtel, B.A., Pitchford, M., Malm, W.C., Frank, N.H. (2012) Seasonal composition of remote and urban fine particulate matter in the United States, Journal of Geophysical Research: Atmosphere, 117(D5), D05209.
[https://doi.org/10.1029/2011JD017122]

-
Huang, X., Qiu, R., Chan, C.K., Kant, P.R. (2011) Evidence of high PM2.5 strong acidity in ammonia-rich atmosphere of Guangzhou, China: Transition in pathways of ambient ammonia to form aerosol ammonium at [NH4+]/[SO42-]=1.5, Atmospheric Research, 99(3-4), 488-495.
[https://doi.org/10.1016/j.atmosres.2010.11.021]

-
Kaneyasu, N., Ohta, S., Murao, N. (1995) Seasonal variation in the chemical composition of atmospheric aerosols and gaseous species in Sapporo, Japan, Atmospheric Environment, 29(13), 1559-1568.
[https://doi.org/10.1016/1352-2310(94)00356-P]

-
Keywood, M.D., Ayers, G.P., Gras, J.L., Gillett, R.W., Cohen, D.D. (1999) Relationships between size segregated mass concentration data and ultrafine particle number concentrations in urban areas, Atmospheric Environment, 33, 2907-2913.
[https://doi.org/10.1016/S1352-2310(99)00102-8]

-
Kim, H.-J., Zhang, Q., Bae, G.-N., Kim, J.-Y., Lee, S.-B. (2017) Sources and atmospheric processing of winter aerosols in Seoul, Korea: insights from real-time measurements using a high-resolution aerosol mass spectrometer, Atmospheric Chemistry and Physics, 17, 2009-2033.
[https://doi.org/10.5194/acp-17-2009-2017]

- Kim, J.-H., Park, J.-S., Choi, J.-S., Yoon, G.-H., Kim, S.-D. (2016) A study on the volatilities of PM1.0 chemical components in ambient air using the coupling of a thermodenuder with a high-resolution time-of-flight aerosol mass spectrometer, Journal of the Korean Society of Urban Environment, 16(4), 483-492. https://www.earticle.net/Article/A301390
-
Kim, K.-W. (2015) Optical properties of size-resolved aerosol chemistry and visibility variation observed in the urban site of Seoul, Korea, Aerosol and Air Quality Research, 15, 271-283.
[https://doi.org/10.4209/aaqr.2013.11.0347]

-
Kim, Y.-J., Jung, S.-W., Kang, C.-M., Ma, Y.-I., Kim, S.-H., Woo, J.-H., Sunwoo, Y. (2008) Characteristics of nitrate (NO3-) volatilization from fine particles (PM2.5) at 4 measurement sites in Seoul, Journal of Korean Society for Atmospheric Environment, 24(5), 613-621.
[https://doi.org/10.5572/KOSAE.2008.24.5.613]

-
Kim, Y.-P. (2017) Research and policy directions aganists ambient fine particles, Journal of Korean Society for Atmospheric Environment, 33(3), 191-204.
[https://doi.org/10.5572/KOSAE.2017.33.3.191]

-
Lee, M.-H., Song, M.-J., Moon., K.-J., Han, J.-S., Lee, G.-W., Kim, K.-R. (2007) Origins and chemical characteristics of fine aerosols during the northeastern Asia regional experiment (atmospheric brown cloud east Asia regional experiment 2005), Journal of Geophysical Research, 112(D22S29).
[https://doi.org/10.1029/2006JD008210]

-
Lee, S., Ho, C.-H., Choi, Y.-S. (2011) High-PM10 concentration episodes in Seoul, Korea: Background sources and related meteorological conditions, Atmospheric Environment, 45(39), 7240-7247.
[https://doi.org/10.1016/j.atmosenv.2011.08.071]

-
Lee, S., Kim, M., Kim, S.-Y., Lee, D.-W., Lee H., Kim, J., Le, S., Liu, Y. (2021) Assesment of long-range transboundary aerosols in Seoul, South Korea from geostationary ocean color imager (GOCI) and ground-based observations, Environmental Pollution, 269(15), 115924.
[https://doi.org/10.1016/j.envpol.2020.115924]

-
Lee, Y.-J., Park, M.-K., Jung, S.-A., Kim, S.-J., Jo, M.-R., Song, I.-H., Lyu, Y.-S., Lim, Y.-J., Kim, J.-H., Jung, H.-J., Lee, S.-U., Choi, W.-J., Ahn, J.-Y., Lee, M.-H., Kang, H.-J., Park, S.-M., Seo, S.-J., Jung, D.-H., Hyun, J.-K., Park, J.-S., Hwang, T.-K., Hong, Y.-D., Hong, J.-H., Shin, H.-J. (2015) Characteristics of particulate carbon in the ambient air in the Korean Peninsula, Journal of Korean Society for Atmosphere Environment, 31(4) 330-344.
[https://doi.org/10.5572/KOSAE.2015.31.4.330]

-
Li, X., Wang, L., Ji, D., Wen, T., Pan, Y., Sun, Y. (2013) Characterization of the size-segregated water-soluble inorganic ions in the Jing-Jin-Ji urban agglomeration: Spatial/temporal variability, size distribution and sources, Atmospheric Environment, 77, 250-259.
[https://doi.org/10.1016/j.atmosenv.2013.03.042]

-
Liao, H., Seinfeld, J.H. (2005) Global impacts of gas-phase chemistry-aerosol interactions on direct radiative forcing by anthropogenic aerosols and ozone, Journal of Geophysical Research Atmospheres, 110(D18208).
[https://doi.org/10.1029/2005JD005907]

-
Lim, S.-H., Lee, M., Lee, G., Kim, S., Yoon, S., Kang, K. (2011) Ionic and carbonaceous compositions of PM10, PM2.5 and PM1.0 at Gosan ABC superstation and their ratios as source signature, Atmospheric Chemistry and Physics, 11, 20521-20573.
[https://doi.org/10.5194/acpd-11-20521-2011]

-
Liu, F., Beirle, S., Zhang, Q., Dorner S., He, K., Wagner, T. (2016) NOx lifetimes and emissions of cities and power plants in polluted background estimated by satellite observations, Atmospheric Chemistry and Physics, 16, 5283-5298.
[https://doi.org/10.5194/acp-16-5283-2016]

-
Lundgren, D.A., Hlaing, D.N., Rich, T.A., Marple, V.A. (1996) PM10/PM2.5/PM1 data from a trichotomous sampler, Aerosol Science and Technology, 25, 353-357.
[https://doi.org/10.1080/02786829608965401]

-
Ma, Q., Wu, Y., Zhang, D., Wang, X., Xia, Y., Liu, X., Tian, P., Han, Z., Xia, X., Wang, Y., Zhang, R. (2017) Roles of regional transport and heterogeneous reactions in PM2.5 increase during winter haze episodes in Beijing, Science of The Total Envrionment, 599-600, 246-253.
[https://doi.org/10.1016/j.scitotenv.2017.04.193]

-
Meszaros, E., Barcza, T., Gelencser, A., Hlavay, J., Kiss, Gy., Krivacsy, Z., Molnar, A., Polyak, K. (1997) Size distributions of inorganic and organic species in the atmospheric aerosol in Hungary, Journal of Aerosol Science, 28, 1163-1175.
[https://doi.org/10.1016/S0021-8502(97)00029-3]

- National Institute of Environmental Research (NIER) (2012) A study on concentration characteristics and secondary production of fine particulate matters (PM2.5) by region, NIER-SP 2012-0732.
- National Institute of Environmental Research (NIER) (2016) Study on the chemical characteristics of PM2.5 in case of high concentration episode (III), NIER-RP016-258.
- National Institute of Environmental Research (NIER) (2017) Sampling methods in ambient atmosphere, ES01115.
-
National Institute of Environmental Research (NIER) (2018) Case study of high PM episodes observed in intensive monitoring station (2017), NIER-GP2018-005.Ohta, S., Okita, T. (1990) A chemical characterization of atmospheric aerosol in Sapporo, Atmospheric Environment, 24(4), 815-822.
[https://doi.org/10.1016/0960-1686(90)90282-R]

- National Institute of Environmental Research (NIER) (2019) Summary Report of the 4th stage (2013-2017) LTP Project.
-
Park, E.-H., Heo, J.-B., Kim, H., Yi, S.-M. (2020) Long term trends of chemical constituents and source contributions of PM2.5 in Seoul, Chemosphere, 251, 126371.
[https://doi.org/10.1016/j.chemosphere.2020.126371]

-
Park, J.-S., Park, S.-M., Song, I.-H., Shin, H.-J., Hong, Y.-D. (2015a) Characteristics of visibility impairment by semi-continuous optical and chemical property monitoring of aerosol in Seoul, Journal of Korean Society for Atmospheric Environment, 31(4), 319-329.
[https://doi.org/10.5572/KOSAE.2015.31.4.319]

-
Park, J.-S., Choi, J.-S., Kim, H.-J., Oh, J., Seong, M.-Y., Ahn, J.-Y., Lee, S.-B., Kim, J.-H. (2018a) A study on the characteristics of PM1.0 chemical components using a real-time aerosol mass spectrometer, Journal of Korean Society of Urban Environment, 18(4), 485-494. https://www.earticle.net/Article/A348246
[https://doi.org/10.33768/ksue.2018.18.4.485]

- Park, S.-M., Park, J.-S., Song, I.-H., Shin, H.-J., Hong, Y.-D., Kim, J.-H. (2015). Characteristics of Oxygenated-VOCs and Oxidation of Organic Component in PM1.0 at an Urban Site of Seoul during June, 2014, Journal of the Korean Society of Urban Environment, 15(3), 207-218. https://www.earticle.net/Article/A267050
-
Park, T.-H., Ban, J.-H., Kang, S.-W., Ghim, Y.-S., Shin, H.-J., Park, J.-S., Park, S.-M., Moon, K.-J., Lim, Y.-J., Lee, M.-D., Lee, S.-B., Kim, J.-S., Kim, S.-T., Bae, C.-H., Lee, Y.-H., Lee, T.-H. (2018b) Chemical characteristics of PM1 using aerosol mass spectrometer at Baengnyeong Island and Seoul metropolitan area, Journal of Korean Society for Atmospheric Envrionment, 34(3), 430-446.
[https://doi.org/10.5572/KOSAE.2018.34.3.430]

-
Parmar, R.S., Satsangi, G.S., Kumari, M., Lakhani, A., Srivastava, S.S., Prakash, S. (2001) Study of size distribution of atmospheric aerosol at Agra, Atmospheric Environment, 35, 693-702.
[https://doi.org/10.1016/S1352-2310(00)00317-4]

-
Perrone, M.G., Gualtieri, M., Ferrero, L., Porto, C.L., Bolzacchini, E. (2010) Seasonal variations in chemical composition and in virtro biological effects of fine PM from Milan, Chemosphere, 78, 1368-1377.
[https://doi.org/10.1016/j.chemosphere.2009.12.071]

-
Russell, A.G., McRae, G.J., Cass, G.R. (1983) Mathematical modeling of the formation and transport of ammonium nitrate aerosol, Atmospheric Environment, 17, 949-964.
[https://doi.org/10.1016/0004-6981(83)90247-0]

- Seinfeld, J.H., Pandis, S.N. (2016) Atmospheric chemistry and physics: From air pollution to climate change, 3rd Ed., John Wiley & Sons Inc., U.S.A.
-
Shin, H.-J., Lim, Y.-J., Kim, J.-H., Jung, H.-J., Park, S.-M., Park, J.-S., Song, I.-H., Seo, S.-J., Hong, Y.-D., Han, J.-S. (2016) The characteristics of long term high PM episode occurred in Feb. 2014, Journal of the Korean Society of Urban Envrionment, 14(3), 223-232.
[https://doi.org/10.1155/2016/2424875]

-
Simon, H., Bhave, P.V., Swall, J.L., Frank, N.H., Malm, W.C. (2011) Determining the spatial and seasonal variability in OM/OC ratios across the US using multiple regression, Atmospheric Chemistry and Physics, 11, 2933-2949.
[https://doi.org/10.5194/acp-11-2933-2011]

-
Singh, D.K., Gupta, T. (2016) Source apportionment and risk assessment of PM1 bound trace metals collected during foggy and non-foggy episodes at a representative site in the Indo-Gangetic plain, Science of The Total Environment, 550(15), 80-94.
[https://doi.org/10.1016/j.scitotenv.2016.01.037]

-
Streets, D.G., Bond, T.C., Carmichael, G.R., Fernandes, S.D., Fu, Q., He, D., Klimont, Z., Nelson, S.M., Tsai, N.Y., Wang, M.Q., Woo, J.-H, Yarber, K.F. (2003) An inventory of gaseous and primary aerosol emissions in Asia in the year 2000, Journal of Geophysical Research Atmospheres, 108, 148-227.
[https://doi.org/10.1029/2002JD003093]

-
Sun, Y.L., Zhuang, G.S., Tang, A.H., Wang, Y., An, Z.S. (2006) Chemical characteristics of PM2.5 and PM10 in haze-fog episodes in Beijing. Environtal Science & Technology, 40(10), 3148-3155.
[https://doi.org/10.1021/es051533g]

-
Turpin, B.J., Lim, H.J. (2010) Species contributions to PM2.5 mass concentrations: Revisiting common assumptions for estimating organic mass, Aerosol Science and Technology, 35(1), 602-610.
[https://doi.org/10.1080/02786820119445]

- U.S. Environmental Protection Agency (US EPA) (1999) Determination of reactive acidic and basic gases and strong acidity of atmospheric fine particles (<2.5 μm), US EPA Compendum method IO-4.2, EPA//625/R-96/010a.
-
Vallius, M.J., Ruuskanen, J., Mirme, A., Pekkanen, J. (2000) Concentrations and estimated soot content of PM1, PM2.5, and PM10 in a subarctic urban atmosphere, Environmental Science & Technology, 34, 1919-1925.
[https://doi.org/10.1021/es990603e]

- World Health Organization (WHO) (2013a) Health effects of particulate matter-Policy implications for countries in eastern Europe, Caucasus and central Asia.
- World Health Organization (WHO) (2013b) Outdoor air pollution a leading environmental cause of cancer deaths.
-
Zhang, L., Vet, R., Wiebe, A., Mihele, C., Sukloff, B., Chan, E., Moran, M.D., Iqbal, S. (2008) Characterization of the size-segregated water-soluble inorganic ions at eight Canadian rural sites, Atmospheric Chemistry and Physics, 8, 7133-7151.
[https://doi.org/10.5194/acp-8-7133-2008]

-
Zhang, C., Wang, L., Qi, M., Ma, X., Zhao, L., Ji, S., Wang, Y., Lu, X., Wang, Q., Xu, R., Ma, Y. (2018) Evolution of key chemical comonents in PM2.5 and potential formation mechanisms of serious haze events in Handan, China, Aerosol and Air Quality Research, 18, 1545-1557.
[https://doi.org/10.4209/aaqr.2017.10.0386]

-
Zhao, Y.L., Gao, Y. (2008) Mass size distributions of water-soluble inorganic ions in size-segregated aerosols over metropolitan Newark in the US east coast, Atmospheric Envrionment, 42, 4063-4078.
[https://doi.org/10.1016/j.atmosenv.2008.01.032]

-
Zhuang, H., Chan, C.K., Fang, M., Wexler, A.S. (1999) Size distributions of particulate sulfate, nitrate, and ammonium at a coastal site in Hongkong, Atmospheric Environment, 33, 843-853.
[https://doi.org/10.1016/S1352-2310(98)00305-7]

권수진 (서울대학교 보건대학원 환경보건학과 박사과정) (sjkwon826@snu.ac.kr)
임형배 (국립환경과학원 대기환경연구과 전문연구위원) (lhb2435@korea.kr)
신혜정 (국립환경과학원 대기환경연구과 연구관) (shjoung@korea.kr)
이상진 (울산과학기술원 도시환경공학과 박사과정) (lsjin1347@unist.ac.kr)
최성득 (울산과학기술원 도시환경공학과 교수) (sdchoi@unist.ac.kr)
이지이 (이화여자대학교 환경공학과 교수) (yijiyi@ewha.ac.kr)
