
지난 17년간 서울에서 미세먼지 대기오염 농도는 증가했는가?: 대중의 인식과 실제 농도의 차이
Copyright © 2020 Korean Society for Atmospheric Environment
Abstract
While there have been growing public concerns on increased particulate matter (PM) air pollution in South Korea, published summaries based on regulatory monitoring data showed decreasing patterns over years. Aiming to identify the pollution features aligned with public concerns, we developed diverse statistics that represent daily PM with a diameter ≤10µm (PM10) and explored temporal patterns for 2001~2017 in Seoul, Korea. We obtained PM10 hourly measurements at 25 urban background regulatory monitoring sites in Seoul for 2001~2017. In addition to daily averages commonly used in previous studies, we computed 15 additional daily statistics for three features: 1) within-day concentration level, 2) between-days difference, and 3) within-day hourly categorization. For the within-day concentration level, we used four statistics: 24-hour mean, 5th percentile, 95th percentile, and interquartile range. The between-days difference statistics were computed as the difference in the mean, minimum, or maximum concentrations on the concurrent day from that on the past one or three days. The within-day hourly categorization includes the number of hours for daytime and 24 hours in each of the three categories based on the Comprehensive Air-quality Index (“Good”, “Moderate”, and “Unhealthy” for <30, 31~80, and 81~150 µm/m3, respectively). To assess the temporal patterns of PM10 concentrations, we created year-specific time-series boxplots for each of the 16 statistics over 17 years. Using within-day concentration level statistics, PM10 concentrations generally decreased over 17 years with stable or slightly increasing patterns for the recent six years since 2012. The within-day hourly categorization statistics also showed overall increases in “Good” hours over 17 years and recent decreases. Our results suggest that public concerns on PM are possibly related to stable concentrations for the recent 6 years despite an overall decrease for 17 years. Future studies should confirm our findings by expanding our investigation to different areas.
Keywords:
Air pollution, Particulate matter, Public perception, Statistic, Temporal pattern1. 서 론
최근 대기오염과 대기오염의 건강영향에 대한 국민적 관심도가 높아지고 있다. 대기오염 물질 중 국민적 관심이 집중되는 대기오염물질은 단연 미세먼지 (Particulate Matter: PM)이다. 2019년 환경부가 전국 1,111명을 대상으로 실시한 미세먼지 인식 조사에 따르면, 대다수인 92.3%가 “10년 전에 비해 미세먼지 오염이 나빠졌다”고 답했고, 우리나라 미세먼지 피해가 미국 및 유럽 등 환경 선진국에 비해 심각하다는 응답도 94.7%로 대다수였다 (KEI, 2019). 이러한 미세먼지 악화에 대한 전반적인 인식은 2018년 환경부 설문조사나 질병관리본부 등 다른 기관에서 실시한 설문조사에서도 동일한 결과를 보였다. 환경부의 2018년도 미세먼지 인식 조사에 따르면, 응답자의 92%가 미세먼지 오염도가 심각하다고 인식하고 있었으며 해당 응답자의 83%가 건강에 위협적이라고 인식하고 있었다 (MOE, 2018).
미세먼지의 인체 유해성은 이미 많은 역학연구를 통해 입증되었다. 수많은 역학 연구에서는 단기 및 장기간의 미세먼지 노출은 사망, 호흡기계 및 심혈관계 질환, 암에 영향을 미치는 것으로 보고하였다 (U.S. EPA, 2019; Hoek et al., 2014; Pope et al., 2006). 이러한 연구 결과를 바탕으로 세계보건기구 (World Health Organization: WHO)는 2013년 미세먼지에 대해 인간에게 발암성이 있는 것으로 확인된 물질을 뜻하는 1군 발암물질로 분류했다. 국내에서 수행되었던 역학연구에서도 미세먼지 노출은 건강에 악영향을 미치는 것으로 보고되었다 (Bae and Kwon, 2019; Kwon et al., 2019; Kim et al., 2017; Kim et al., 2016).
하지만 미세먼지에 대한 국민적인 불안감과 달리 많은 국내 연구 결과와 정부 간행물은 미세먼지 측정 데이터의 일간 그리고 연간 평균의 추이는 지속적으로 감소하고 있다고 보고했다 (Kim and Lee, 2018; MOE, 2017). 특히, 수도권 내에서 서울은 2004년부터 2008년까지 미세먼지 농도가 크게 감소했다. 농도 감소의 이유 중 하나로 언급되는 것은 정부의 미세먼지 저감 정책이다 (Kim and Lee, 2018). 수도권에서는 1981년부터 대기오염 물질 농도를 줄이기 위한 저감 대책이 시행되고 있으며 2003년에는 “수도권 대기환경개선에 관한 특별법”이 제정되었고 해당 특별법에 의거한 ‘수도권 대기환경관리 기본계획’이 2005년에 발표되어 2007년부터 추진되고 있다 (Han et al., 2017). 또한 국립환경과학원은 전국 96개 시군 도시대기측정망의 대기오염 농도의 연평균 변화 추이에서 미세먼지를 포함한 대부분의 대기오염물질 농도가 개선되고 있다고 보고했다 (MOE, 2017).
그렇다면 측정자료에서 미세먼지가 감소하고 있는 것과 반대경향을 보이는 우리나라 국민들이 인식하고 있는 미세먼지의 농도의 증가는 어떻게 설명할 수 있을까? 미세먼지 농도가 장기적인 관점에서 줄어들고 있다는 연구 결과는 최근 대중의 미세먼지에 관한 인식이 과학적 데이터에 기반한 사실과 차이가 있음을 보이고 있다. 미세먼지에 대한 대중의 체감 오염도와 과학적인 사실 사이의 차이를 이해하기 위해서는, 미세먼지 추세 및 실태에 대한 정확한 이해가 필요하다. 기존 미세먼지 농도 추이 연구에는 주로 일, 월, 그리고 연 단위의 평균농도 통계값을 이용하였다. 이러한 평균값 중심의 통계량은 대중의 체감 오염도를 대변하기 어려울 수 있다. 미세먼지의 일평균이나 연평균 이외에 다른 통계량이 대중의 체감 오염도를 효과적으로 대변할 수 있을 가능성이 있다. 최근 대중적인 우려와 실제 미세먼지 농도의 감소 경향 간 차이에 관심을 가진 다른 연구들에서도 평균농도 외에 연간 고농도 사례 발생 빈도나 연속일수, 초미세먼지와 미세먼지의 비율을 살펴보았다 (Yeo and Kim, 2019; Yeo et al., 2019). 그러나 이러한 지표들에서도 공통적으로 감소추세를 보였고 체감 오염도와의 차이가 지적되었다.
본 연구는 최근 미세먼지 농도가 악화되고 있다는 체감 오염도를 나타낼 수 있는 대체적인 지표 탐색을 위해 다양한 통계량을 사용하고자 한다. 미세먼지 농도의 평균값뿐 아니라, 변이와 차이를 고려한 통계량을 이용하여 2001년에서 2017년 동안 서울에서 미세먼지 농도의 시간적 추이를 살펴보고, 기존 평균값과의 추이를 비교하고자 한다. 특히, 대중적인 인식이 단기간 농도 변화에 주요한 영향을 받는다는 가정 아래, 연간 변화보다는 일간 및 일 내 농도의 변이 및 차이에 집중하였다. 이러한 다양한 통계량의 탐색은 미세먼지의 농도 변화에 대한 대중적인 인식과정을 이해하고 미세먼지 관련 정책적인 노력에서 대중과의 효과적인 의사소통에 기여할 것으로 기대된다.
2. 연구 방법
2001년부터 2017년간 매일 시간별 주기로 전국 대기오염물질 농도를 측정한 값들 중 25개의 서울 대기오염측정망 측정소에서 측정한 지름이 10 µm 이하인 미세먼지 (PM10) 농도를 국립환경과학원에서 획득했다. 획득한 미세먼지 농도 측정자료를 이용해서 17년간 농도의 변화추이를 나타낼 수 있는 통계량을 세 가지 방법으로 계산하였다. 세 방법은 (1) 일별 농도, (2) 일간 농도 차이, (3) 일별 미세먼지 농도 기준별 시간의 합으로 구성하였다. 표 1에서는 이 세 가지 방법의 의미와 세 방법에 따른 16개의 통계량을 제시하였다. 이들 16개 값들 각각에 대해 17년간 미세먼지 농도의 변화 추이를 연도별 상자그림을 이용해서 살펴보았다. 즉, 17년간의 변화는 측정소-날짜별 각 통계량 농도들 (측정소 25개×365일)의 연도별 상자그림으로 탐색하였다.

Three approaches of 16 statistics that summarize daily PM10 concentrations at each site and are possibly related to public perception on the temporal trend of PM concentrations for 2001~2017 in Seoul, Korea.
첫 번째 평가 방법인 일별 미세먼지 농도의 추이 탐색에 사용된 통계량은 총 4개로 각 측정소와 날짜별로 계산하였다. 4가지 통계량으로는 1) 24시간 평균, 2) 5번째 백분위 수, 3) 95번째 백분위 수, 그리고 4) 75%에서 25%의 차이값인 사분범위 (interquartile range)를 사용하였다. 측정소-날짜별로 계산된 통계량 값은 측정소가 설치된 지역의 공간적인 개념과 날짜의 시간적인 개념이 함축된 미세먼지 농도의 시공간적 변화를 나타낼 수 있다. 극단으로 높거나 낮은 농도는 전반적인 경향을 탐색하기에는 적당하지 않기 때문에, 하루 중 최소나 최고 농도 대신 5%와 95%에 해당하는 농도를 이용해서 최소 및 최대 농도의 추이를 살펴보고자 하였다. 또한 사분범위를 통해 일별의 대략적인 농도 변화폭을 파악하였다. 이들 4개 통계량의 연도별 상자그림을 통해, 농도의 평균, 최소, 최대, 변화폭의 차이가 어떻게 변화했는지 17년간의 변화를 파악하고자 하였다.
일간 농도 차이는 근래의 농도 차이 변화폭이 크거나 작아질 경우 일 혹은 연평균 값과 무관하게 대중의 미세먼지 농도 인식에 영향을 줄 수 있다는 가설에 근거하여, 기준일과 최근 하루 또는 최근 3일 사이의 농도 차이로 계산하였다. 사용된 통계량은 여섯 가지로, 일평균농도, 일 최소 농도, 그리고 일 최대 농도를 이용해서 하루 전 및 3일 전 농도와의 차이로 계산하였다. 6개 통계량의 17년간 연도별 상자그림은 일간 농도 차이의 시간적 추이를 나타낸다.
마지막으로 대중이 미세먼지 고농도에 노출된 시간 수가 증가함에 따라 체감 오염도가 높아질 수 있을 것이라는 가정 하에 미세먼지 농도 기준별 시간 합의 추세를 살펴보았다. 사용된 미세먼지 농도 기준은 환경부에서 대기오염 농도 예보에 사용하고 있는 통합대기환경지수 (CAI; Comprehensive Air-quality Index)를 이용하였다. 해당 지수는 대기오염도에 따른 인체 영향 및 체감 오염도를 고려하여 미세먼지 농도 범위에 따라 ‘좋음 (0~30 µg/m3)’, ‘보통 (31~80µg/m3)’, ‘나쁨 (81~150 µg/m3)’, ‘매우나쁨 (151 µg/m3이상)’의 4가지 기준을 제시하고 있다. 본 연구에서는 4개 구간 중 ‘좋음’, ‘보통’, 그리고 ‘나쁨’에 해당되는 일별 시간 수를 계산하였다. 이때, 대중들의 미세먼지 체감을 보다 잘 나타내기 위해 24시간뿐 아니라 주 활동 시간대인 오전 7시에서 오후 6시까지의 낮 12시간 동안 시간 총합도 계산하였다. 이들 6개 일별 측정소별 통계량의 연도별 상자그림을 통해 17년간 추이를 살펴보았다.
17년간의 연도별 16개 통계량에 대한 상자그림으로 진행한 주요분석 이외에, 장소나 계절에 따른 추이의 차이가 있는지 탐색하기 위한 추가분석도 진행하였다. 장소에 따른 추이 차이를 탐색하기 위해, 서울 도시대기 측정소 25개별로 각 연도의 평균, 중앙값, 5번째 백분위 수, 95번째 백분위 수를 계산한 후 17년 동안의 시간적 추이를 살펴보았다. 미세먼지 농도의 계절별 추이는 봄, 여름, 가을, 겨울별로 측정소-날짜별 평균과 95번째 백분위 수의 17년 동안 시간적 경향을 탐색하였다.
3. 연구 결과
그림 1은 일별 미세먼지 농도를 나타내는 네 가지 통계량을 이용해서 17년간 미세먼지 변화 추이의 탐색결과를 보여준다. 24시간 평균, 최소값, 최대값, 그리고 사분범위 모두에서 대체적으로 비슷한 감소 경향을 보였다. 네 개의 통계량에서 모두 2001년도에서 2012년도까지 미세먼지 농도는 대체적으로 감소하였고 2012년부터 2017년도까지는 정체되거나 조금씩 증가하는 양상을 보였다. 특히 2016년도의 미세먼지 농도는 주변 연도에 비해 높은 경향을 보였다.
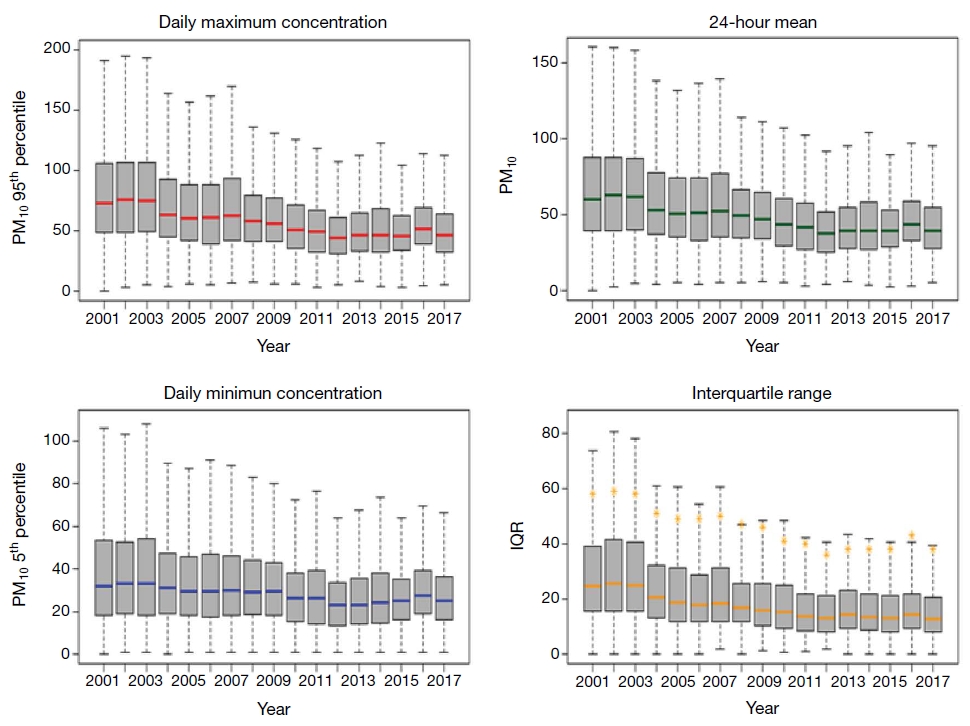
Trends of yearly boxplots for four statistics of PM10 within-day concentration levels (24-hour mean, minimum represented by 5th percentile, maximum represented by 95th percentile, and, interquartile range concentrations) for 2001~2017 in Seoul (lower end, middle line, and upper end of the box indicating 25th, 50th, and 75th percentiles, respectively; lower and upper whiskers indicating 25th percentile - 1.5×interquartile range and 75th percentile+1.5×interquartile range, respectively).
일간 농도 차이를 대표하는 여섯 가지 통계량을 이용한 상자그림을 제시한 그림 2에서는 연도별로 뚜렷한 변화 패턴이 발견되지 않았다. 일평균, 일 최소값, 그리고 일 최대값들을 이용해서 계산한 일간 농도는 연도별로 중앙값이 대부분 3 µg/m3 이하로 0에 가까웠고, 이는 기준일보다 하루 전날들의 미세먼지 농도가 높았던 정도와 낮았던 정도가 비슷했다는 것을 나타낸다. 최근 1일간 차이와 최근 3일간 차이의 패턴은 또한 비슷했다.
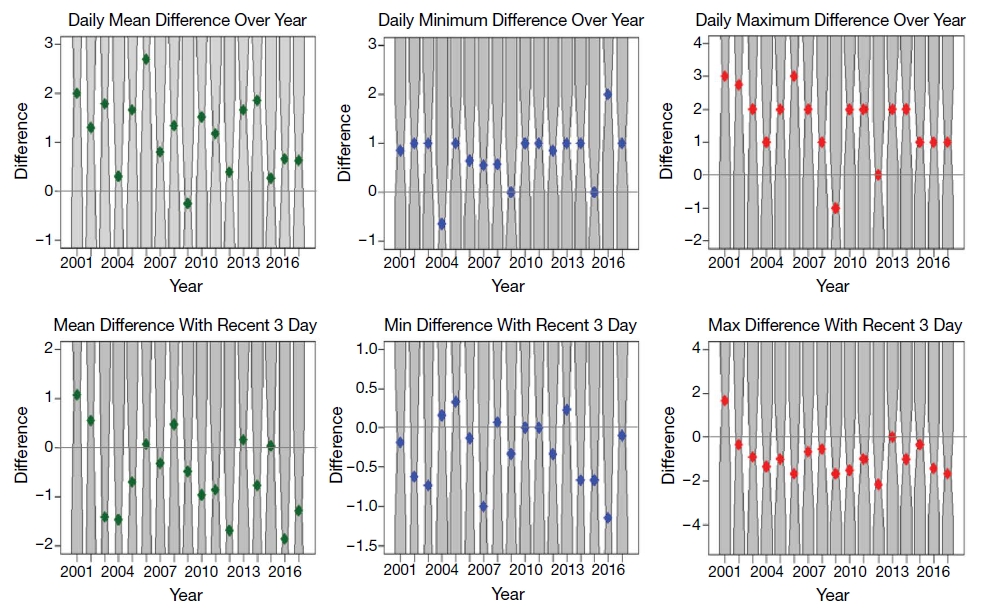
Trends of yearly boxplots for six statistics of PM10 between-day concentration levels (one-day and three-day differences for daily maximum, minimum, and mean concentrations) for 2001~2017 in Seoul.
마지막으로 미세먼지 예보 기준에 사용되는 통합대기환경지수 (CAI) 구간별 일년간 시간 총합의 수 추이는 그림 3과 같다. 농도기준 ‘좋음’의 경우 1년 동안 ‘좋음’에 해당하는 일별 시간 총합의 연 범위가 시간에 따라 눈에 띄게 증가했음을 확인할 수 있다. 특히 2012년도까지 꾸준히 시간 수가 증가했으나, 그 후로 2015년도까지는 다시 감소하는 경향을 보였다. 연 중앙값을 살펴보면 2012년도부터 그 전년도들에 비해 높아졌으나 2012~2017년도 구간에서 줄어드는 경향을 보인다. ‘보통’ 구간의 경우 일별 시간 총합은 연도별로 비슷했으나, 중앙값은 장기적으로는 조금씩 증가하는 추세를 보였다. 마지막으로 ‘나쁨’ 구간에서는 2008년도 이후 해당 시간 수가 크게 줄었음을 확인할 수 있었다. 다만, 24시간에 해당하는 시간 수의 경우, 2012년 이후 “나쁨” 구간의 시간 수가 약간 증가하는 경향을 보였다.
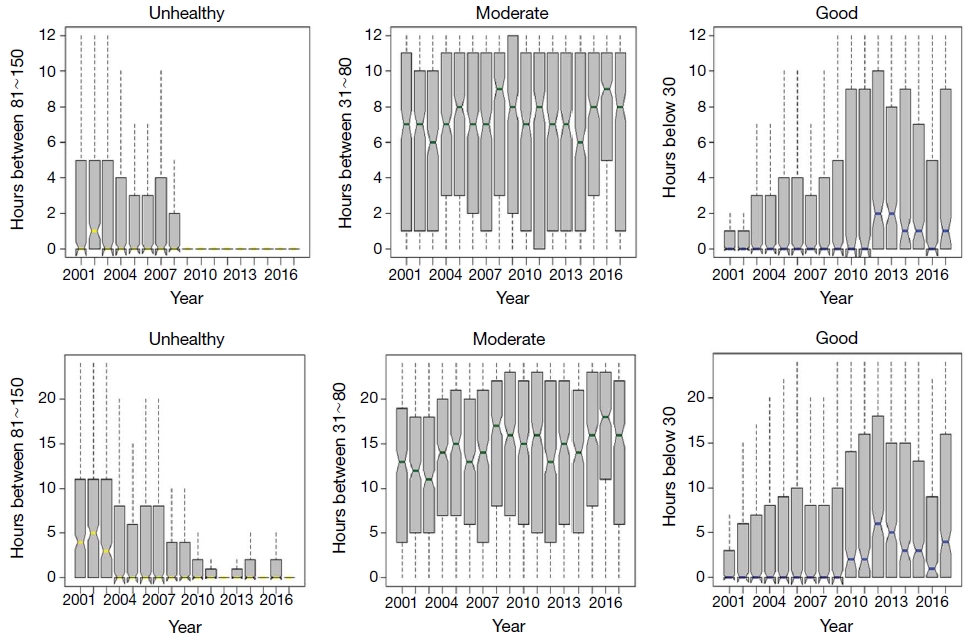
Trends of yearly boxplots for six statistics of PM10 within-day hourly categorization (numbers of hours corresponding to three CAI categories for daytime (top three) and 24 hours (bottom three)) for 2001~2017 in Seoul (lower end, middle line, and upper end of the box indicating 25th, 50th, and 75th percentiles, respectively; lower and upper whiskers indicating 25th percentile - 1.5×interquartile range and 75th percentile+1.5×interquartile range, respectively).
추가분석에서, 서울 도시대기 측정소 25개의 미세먼지 농도는 연평균, 연 중앙값, 연 5번째 및 95번째 백분위 수 모두에서 17년간 줄어드는 경향을 보였다 (그림 4). 측정소 25개 간 농도의 차이는 2008년도 이후 급격하게 감소하였다. 계절별로는 봄, 여름, 가을, 그리고 겨울 모두 평균과 최대값에서 17년간 장기적으로 미세먼지 농도가 감소하는 경향을 보였다 (그림 5). 또한 전체 계절의 일별 농도 경향과 마찬가지로 2012년 이후 미세먼지 농도가 과거에 비해 정체되는 모습을 보였다. 여름과 가을에 비해 봄과 겨울에 전반적으로 미세먼지 농도가 높았다.
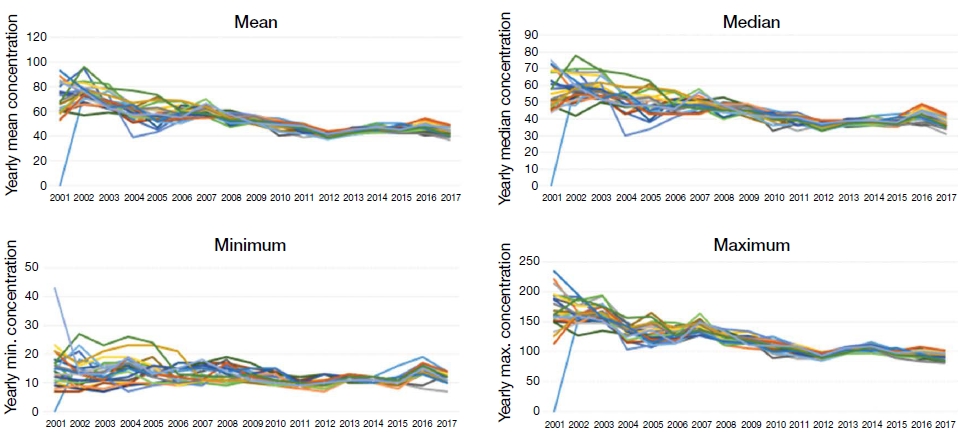
Time-series plots of yearly mean, median, minimum (represented by 5th percentile), and maximum (represented by 95th percentile) PM10 concentrations across 25 urban background sites (represented by different colors) of the regulatory air quality monitoring network for 2001~2017 in Seoul.
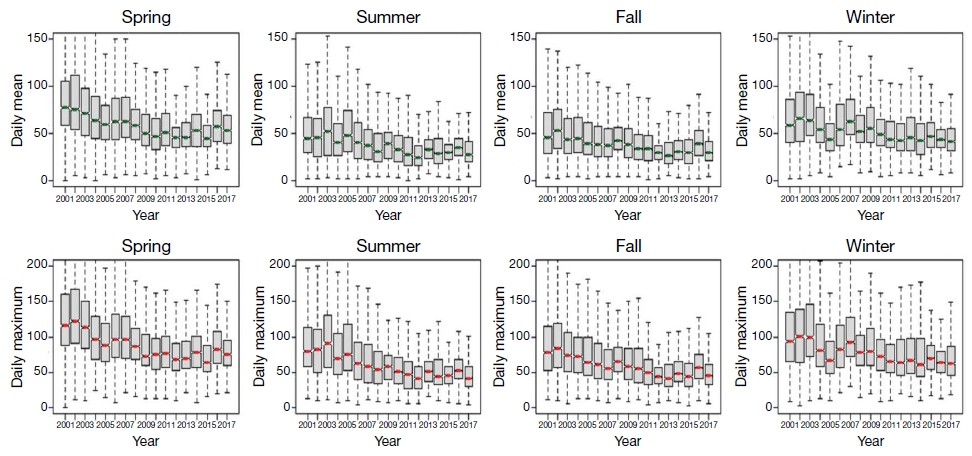
Trends of yearly boxplots of daily mean (top) and maximum (bottom) PM10 concentrations by four seasons for 2001~2007 in Seoul (lower end, middle line, and upper end of the box indicating 25th, 50th, and 75th percentiles, respectively; lower and upper whiskers indicating 25th percentile - 1.5×interquartile range and 75th percentile+1.5×interquartile range, respectively).
4. 고찰 및 결론
기존 미세먼지 추이 연구에서는 일평균, 연평균과 같은 평균의 개념이 기본 통계량 값으로 사용하였다. 하지만 이러한 미세먼지 농도의 평균값은 대기오염 측정망 자료가 공개되는 2001년부터 지속적인 감소추세에 있고, 이러한 추세는 최근 미세먼지에 대한 국민적 우려와 높은 체감 오염도를 설명하기에 제한적일 수 있다. 따라서 본 연구는 기존 연구에서는 사용되지 않은 다양한 통계량 값을 사용하여 2001~2017년 17년간의 시간적인 추이를 탐색함으로써, 대중의 체감 오염도를 설명하고자 하였다. 16가지 다양한 통계값은 일별 농도, 일간 농도 차이, 미세먼지 농도 기준별 시간 합의 세 가지 방법으로 계산하였다. 16개 통계값을 이용해서 연도별 상자그림의 17년간 경향을 탐색한 결과, 모든 통계량에서 전반적인 감소 경향과 2012년 이후 정체 경향을 일관적으로 관찰할 수 있었다. 이러한 경향은 측정소별이나 계절별로도 비슷한 결과를 보였다.
본 연구에서는 대중의 미세먼지 체감농도를 대별할 수 있는 다양한 통계량 값을 고려했음에도 불구하고 평균값을 이용한 결과와 비슷한 결론이 도출되었다. 2012년도부터의 농도 정체 혹은 악화를 제외하고는 17년간의 장기적인 관점에서의 미세먼지 농도는 여전히 개선되고 있었다. 구체적으로 일별 농도 패턴에서 2012년도부터 정체된 미세먼지 농도의 영향이 있음을 확인했다. 이러한 경향은 통합대기환경지수에 기반한 미세먼지 예보 기준별 시간의 총 합 추이에서도 관찰되었다. 2009년까지 미세먼지 ‘좋음’의 시간 합이 증가, 즉 농도가 크게 개선되었으나, 그 후에는 다소 정체되거나 악화되는 경향을 확인했다. 다양한 통계량에 대한 일관적인 농도 감소 경향은, 대중의 미세먼지 체감 오염도가 과학적인 측정자료에 기반한 추이와 차이가 있다는 것을 뜻한다.
국내에서 보여지는 대중의 환경오염 인식과 과학적 사실과의 간극은 새롭거나 한국만의 현상이 아니며 해외의 다양한 사례에서도 찾아볼 수 있다. 또한 같은 국가 혹은 지역에 거주하는 사람들 사이에서도 체감 오염도의 차이는 존재한다. 예를 들어, 뉴욕의 택시운전사들은 그들이 미세먼지에 노출된 심각성에 비해 오염에 대한 인식이 부족했다 (Gany et al., 2017). 그리스의 연구에서는 사람들의 성별, 나이, 흡연 유무, 그리고 건강 상태에 따라 공기오염에 대한 체감 정도가 다르다고 밝혔다 (Pantavou et al., 2018). 중국 우한 지역의 부모들은 과학적 자료에 기반한 공기오염도보다 대체적으로 높은 체감 오염도를 가지고 있었으며 교육수준과 아이의 건강 상태에 따라 다른 인식 정도를 보여주었다 (Guo et al., 2016). 이러한 대중적인 이해와 과학적인 전문지식 사이의 차이에 대해서는, 과학적인 연구 결과의 기술적인 측면에 따른 이해의 어려움이 주요한 원인으로 지적되었다 (Oltra and Sala, 2015).
최근 대중의 미세먼지 농도 인식이 과학적인 사실과 차이가 있는 불필요한 공포감이라면, 과학적인 정보제공을 통해 불필요한 우려를 방지할 수 있겠다. 과학적이고 정확한 정보를 제공함으로써 미세먼지 및 미세먼지의 건강영향에 대한 정확한 이해를 도울 필요가 있다. 대중에게 미세먼지의 경각심을 심어주는 것도 중요하지만 과학적인 데이터에 기반한 미세먼지 추이에 대한 적극적인 전달도 필요하다. 인터넷을 이용한 정보 획득이 일상화된 만큼, 웹을 이용한 가시화 등도 정보제공의 유용한 대안으로 가능할 것이다 (Mwalongo et al., 2016; Hervas and Bravo, 2011; Park et al., 2000).
본 연구는 연구지역과 포함된 오염물질 등에서 제한점을 가지고 있고, 후속 연구에서는 이를 보완할 필요가 있다. 본 연구에서는 서울에서 PM10의 추이를 집중적으로 살펴보았다. 추후 연구에서는 PM2.5와 같은 다른 오염물질의 농도 추이와 전국 단위의 연구를 진행하는 것도 필요하다. PM2.5는 2015년부터 본격적으로 측정자료가 공개되기 시작했다는 한계성 때문에 본 연구에 포함되지는 않았다. 그러나, 서울지역에서 PM2.5의 일평균과 연평균 및 연간 고농도 사례 발생 빈도나 연속일수를 이용했었던 이전 연구에서도 PM10과 비슷한 전체적인 감소 경향을 보였다 (Yeo et al., 2019). 추후 연구에서는 다양한 통계량 값들을 PM2.5 자료에 적용해서 농도 추이를 살펴보아야 하겠다. 마지막으로 연구지역을 전국 단위로 확대시켜서 다양한 통계량을 이용한 농도 추이를 이해하는 것이 필요하다.
Acknowledgments
본 연구는 한국연구재단의 지원을 받아 수행된 기초연구사업 (과제번호: 2013R1A6A3A04059017; 2018R1A2B600460)과 국립암센터의 기관고유사업 (NCC-1810220-01)의 일환으로 수행되었습니다.
References
-
Bae, S., Kwon, H.J. (2019) Current state of research on the risk of morbidity and mortality associated with air pollution in Korea, Yonsei Medical Journal, 60(3), 243-256
[https://doi.org/10.3349/ymj.2019.60.3.243]

-
Gany, F., Bari, S., Prasad, L., Leng, J., Lee, T., Thurston, G.D., Gordon, T., Acharya, S., Zelikoff, J.T. (2017) Perception and reality of particulate matter exposure in New York City taxi drivers, Journal of Exposure Science and Environmental Epidemiology, 27(2), 221-226
[https://doi.org/10.1038/jes.2016.23]

-
Guo, Y., Liu, F., Lu, Y., Mao, Z., Lu, H., Wu, Y., Chu, Y., Yu, L., Liu, Y., Ren, M., Li, N., Chen, X., Xiang, H. (2016) Factors affecting parent’s perception on air quality - from the individual to the community level, International Journal of Environmental Research and Public Health, 13, 493
[https://doi.org/10.3390/ijerph13050493]

-
Han, H., Jung, C.H., Kum, H.S., Kim, Y.P. (2017) The revisit on the PM10 reduction policy in Korea: focusing on policy target, tools and effect of 1st Air Quality Management Plan in Seoul Metropolitan Area, Journal of Environmental Policy and Administration, 25(1), 49-79
[https://doi.org/10.15301/jepa.2017.25.1.49]

-
Hervás, R., Bravo, J. (2011) Towards the ubiquitous visualization: Adaptive user-interfaces based on the semantic web, Interacting with Computers, 23, 40-56
[https://doi.org/10.1016/j.intcom.2010.08.002]

-
Hoek, G., Krishnan, R.M., Beelen, R., Peters, A., Ostro, B., Brunekreef, B., Kaufman, J.D. (2014) Long-term air pollution exposure and cardio-respiratory mortality: A review, Environmental Health, 12, 43
[https://doi.org/10.1186/1476-069X-12-43]

-
Kim, K.N., Lim, Y.H., Bae, H.J., Kim, M., Jung, K., Hong, Y.C. (2016) Long-term fine particulate matter exposure and major depressive disorder in a community-based urban cohort, Environmental Health Perspective, 124(10), 1547-1553
[https://doi.org/10.1289/EHP192]

-
Kim, O.J., Kim, S.Y., Kim, H. (2017) Association between long-term exposure to particulate matter air pollution and mortality in a South Korean National Cohort: comparison across different exposure assessment approaches, International Journal of Environmental Research and Public Health, 14, 1103
[https://doi.org/10.3390/ijerph14101103]

-
Kim, Y.P., Lee, G. (2018) Trend of air quality in Seoul: policy and science, Aerosol and Air Quality Research, 18, 2141-2156
[https://doi.org/10.4209/aaqr.2018.03.0081]

- Korea Environment Institute (KEI). (2019) Particulate matter perception survey, KEI focus, 7(2), http://www.kei.re.kr/home/board/keifocus/view.kei
-
Kwon, O.K., Kim, S.H., Kang, S.H., Cho, Y., Oh, I.Y., Yoon, C.H., Kim, S.Y., Kim, O.J., Choi, E.K., Youn, T.J., Chae, I.H. (2019) Association of short- and long-term exposure to air pollution with atrial fibrillation, European Journal of Preventive Cardiology, 26(11), 1208-1216
[https://doi.org/10.1177/2047487319835984]

- Ministry of Environment (MOE). (2017) Annual report of air quality in Korea, Korean Ministry of Environment, Seoul, Korea, https://www.airkorea.or.kr/web/detailViewDown?pMENU_NO=125
- Ministry of Environment (MOE). (2018) "78.7% people reported that particulate matter air pollution is harmful for human health"(gov.kr/portal/ntnadmNews/1628140, )(assessed on 2020.03.09).
-
Mwalongo, F., Krone, M., Reina, G., Ertl, T. (2016) State-of-the-Art Report in Web-based Visualization, Computer Graphics Forum, 35, 553-575
[https://doi.org/10.1111/cgf.12929]

- Oltra, C., Sala, R. (2015) Communicating the risks of urban air pollution to the public, A study of urban air pollution information services, Revista Internacional de Contaminacion Ambiental, 31, 361-375, http://www.scielo.org.mx/pdf/rica/v31n4/v31n4a4.pdf
-
Pantavou, K., Psiloglou, B., Lykoudis, S., Mavrakis, A., Nikolopoulos, G.K. (2018) Perceived air quality and particulate matter pollution based on field survey data during a winter period, International Journal of Biometeorology, 62(12), 2139-2150
[https://doi.org/10.1007/s00484-018-1614-3]

-
Park, Y., Song, I., Yi, J., Yi, S.J., Kim, S.Y. (2020) Web-Based Visualization of Scientific Research Findings: National-Scale Distribution of Air Pollution in South Korea, International Journal of Environmental Research and Public Health, 17, 2230
[https://doi.org/10.3390/ijerph17072230]

-
Pope III, C.A., Dockery, D.W. (2006) Health effects of fine particulate air pollution: lines that connect, Journal of the Air & Waste Management Association, 56(6), 709-742
[https://doi.org/10.1080/10473289.2006.10464485]

- U.S. Environmental Protection Agency (EPA). (2019) Integrated science assessment for particulate matter (Report No. EPA/600/R-19/188); U.S. Environmental Protection Agency, Office of Research and Development: Research Triangle Park, NC, USA, https://cfpub.epa.gov/ncea/risk/recordisplay.cfm?deid=347534
-
Yeo, M.J., Im, Y.S., Yoo, S.S., Jeon, E.M., Kim, Y.P. (2019) Long-term trend of PM2.5 concentration in Seoul, Korean Society for Atmospheric Environment, 35(4), 438-450
[https://doi.org/10.5572/KOSAE.2019.35.4.438]

-
Yeo, M.J., Kim, Y.P. (2019) Trends of the PM10 concentrations and high PM10 concentration cases in Korea, Korean Society for Atmospheric Environment, 35(2), 249-264
[https://doi.org/10.5572/KOSAE.2019.35.2.249]

변성원 (국립암센터 국제암대학원대학교 암관리학과 석사과정)
김선영 (국립암센터 국제암대학원대학교 암관리학과 부교수)