
대기배출사업장 알데하이드류 배출특성 및 실태조사
 ; Jong-Sin Kim ; Mi-Pa Kim ; Hae-Jin Hong ; Geun-Hwa Choi ; Hyo-yun Kim ; Jae-Youn Ryoo ; Kyeong-sig Jeon
Copyright © 2026 Korean Society for Atmospheric Environment
This is an Open Access article distributed under the terms of the Creative Commons Attribution-NoDerivatives 4.0 International (CC BY-ND 4.0) License, which permits copying and redistribution in any medium or format, provided the original work is properly cited. The License does not permit modification, adaptation, translation, transformation, or the creation of derivative works.
Abstract
Aldehydes are volatile organic compounds (VOCs) that can cause adverse health effects and contribute to the formation of secondary pollutants. Although aldehydes are important air pollutants, the current regulatory framework may not fully reflect actual industrial emission characteristics, suggesting the need for continuous review. This study characterized emission patterns and quantified annual emission contributions of four aldehydes-formaldehyde, acetaldehyde, propionaldehyde, and butyraldehyde-from industrial facilities in Jeonbuk State, South Korea. The results were interpreted in relation to the current regulatory framework. Stack sampling was performed at 73 stacks from 56 facilities across six industrial sectors from January to November 2025. Aldehydes were collected with DNPH cartridges and analyzed by HPLC. Annual emissions were estimated from measured concentrations, exhaust flow rates, operating hours, and operating days. To evaluate differences in aldehyde concentrations among sectors, the Kruskal-Wallis test and Dunn’s post hoc test were applied. Aldehyde concentrations exhibited right-skewed distributions with high variability. Consequently, comparisons based on mean and median values did not fully distinguish differences among industrial sectors. However, percentile analysis revealed clear differences at higher concentration levels, particularly in the upper tail. Annual emission estimates further showed that sectoral contributions were concentrated in a limited number of industries. Resin and plastic manufacturing contributed 67.9% of total acetaldehyde emissions, and non-negligible contributions were also observed in sectors outside the current regulatory scope. Aldehyde emission compositions differed across sectors, indicating that priority control compounds vary by industry type. These findings provide quantitative data to improve aldehyde emission monitoring and control strategies.
Keywords:
Aldehydes, Emission characteristics, Annual emission contribution1. 서 론
알데하이드류(aldehydes)는 대표적인 휘발성유기 화합물(Volatile Organic Compounds, VOCs)로서 인체 건강과 대기환경에 다양한 위해성을 지닌 물질군이다. 폼알데하이드(formaldehyde)는 국제암연구소(International Agency for Research on Cancer, IARC) 에 의해 인체 발암물질(Group 1)로 지정되어 있으며(IARC, 2006), 아세트알데하이드(acetaldehyde)는 발암 가능 물질(Group 2B) (IARC, 1999)로 보고된 바 있다. 또한 프로피온알데하이드(propionaldehyde)와 뷰틸알데하이드(butyraldehyde)의 경우 호흡기 자극성과 독성을 갖는 물질로 알려져 있다(TCEQ, 2014; U.S. EPA, 2008).
이러한 인체 위해성 외에도 알데하이드류는 광화학 반응 및 산화반응을 거쳐 오존(O3)과 2차 유기 에어로졸(Secondary Organic Aerosol, SOA)의 생성을 촉진하는 전구물질로 작용한다(Barua et al., 2023; Hallquist et al., 2009). 알데하이드류 중 저분자 알데하이드는 극히 낮은 농도에서도 감지가 가능하여(Ruth, 1986), 소량 배출만으로도 악취 민원을 유발하는 주요 원인물질로 보고되고 있다(Hwang et al., 2018b; Kim and Park, 2018; Woo and Park, 2017; Cho and Song, 2007). 따라서 알데하이드류는 대기환경 보전뿐만 아니라 생활환경 개선과 국민 건강 보호 측면에서 지속적인 관리 필요성이 크다.
알데하이드류는 다양한 산업 공정에서 배출되는 것으로 알려져 있다. 선행 연구에 따르면 폼알데하이드는 아스콘, 금속 주조, 인쇄, 플라스틱 제조 등의 산업에서 발생할 수 있고(Lee and Jung, 2020; Hwang et al., 2018a), 아세트알데하이드는 섬유가공, 석유화학, 합성수지 등의 산업에서 주로 배출된다(Kim et al., 2021; Hwang et al., 2018a). 프로피온알데하이드는 목재 가공, 폐기물 소각 처리시설이 대표적 배출원이며(Do and Jung, 2020), 뷰틸알데하이드는 인쇄, 도장, 도료 및 접착제 제조시설에서 주로 발생한다(Hwang et al., 2018a). 이처럼 알데하이드류는 항목별로 주요 배출 경로와 업종 특성이 상이하기 때문에 업종별 배출특성을 고려한 체계적인 관리가 요구된다(Hwang et al., 2019).
한편 국내 알데하이드류 관리 체계는 항목과 배출 시설 유형에 따라 다르게 적용되고 있다. 폼알데하이드는 모든 배출시설에 대해 배출허용기준을 적용하지만, 아세트알데하이드는 석유 정제품 제조, 폐기물 소각처리 등 특정 배출시설에 한하여 제한적으로 규제하고 있다(MCEE, 2026, 2025a). 또한 프로피온알데하이드와 뷰틸알데하이드의 경우 악취방지법의 지정악취물질에 포함되어 있으나(MCEE, 2025b), 대기환경 보전법상 규제 항목으로는 별도로 지정되어 있지 않다. 이러한 관리 체계는 실제 산업 현장의 배출특성을 충분히 반영하지 못할 우려가 있으며, 배출 실태와 관리 체계 간의 정합성을 확보하기 위한 지속적인 검토가 요구된다. 특히 규제 범위 밖의 업종에서도 알데하이드류 배출 가능성이 제기되고 있는 만큼, 실측 자료를 바탕으로 업종별 배출특성과 배출 기여 구조를 명확하게 파악할 필요가 있다.
이에 본 연구는 전북특별자치도 내 대기배출사업장을 대상으로 알데하이드류의 배출특성과 업종 간 차이를 실측하고, 알데하이드류 관리 체계의 정합성 검토와 배출 기여도에 근거한 관리 대상 설정을 위한 기초자료를 제공하는 것을 목적으로 한다.
2. 연구 방법
본 연구는 2025년 1월부터 11월까지 전북특별자치도 내 대기배출사업장 중 알데하이드류의 배출 가능성이 있거나 실제 검출 이력이 확인된 56개 사업장, 73개 배출구를 대상으로 배출특성을 평가하였다. 조사 대상 업종은 폼알데하이드와 아세트알데하이드를 대기오염물질 배출항목으로 신고한 사업장과 알데하이드류 검출이 확인된 업종을 중심으로 선정하였다. 업종은 합성수지 및 플라스틱 제조시설(resin/plastic manufacturing), 아스콘 제조시설(ascon manufacturing), 폐기물 소각처리시설(waste incineration), 도장 시설 및 부속 건조시설(painting and drying), 반도체 및 기타 전자부품 표면처리시설(semiconductor and electronics surface treatment), 그 밖의 배출시설(other facilities) 등으로 분류하였다(표 1).

Number of surveyed stacks by industrial sector.
각 업종에는 수지의 중합·성형·가열, 골재 건조 및 아스팔트 혼합, 일반폐기물 소각 및 연소, 도장 후 건조 및 경화, 기타 전자부품의 세정·식각·표면처리 등 알데하이드류 생성 또는 배출에 관여할 수 있는 주요 공정이 포함되어 있다. 시료 채취 지점은 도내 산간 지역을 제외한 시·군별 산업단지 지역에 고르게 분포시켰으며, 그림 1에 이를 색상으로 구분하여 나타냈다.
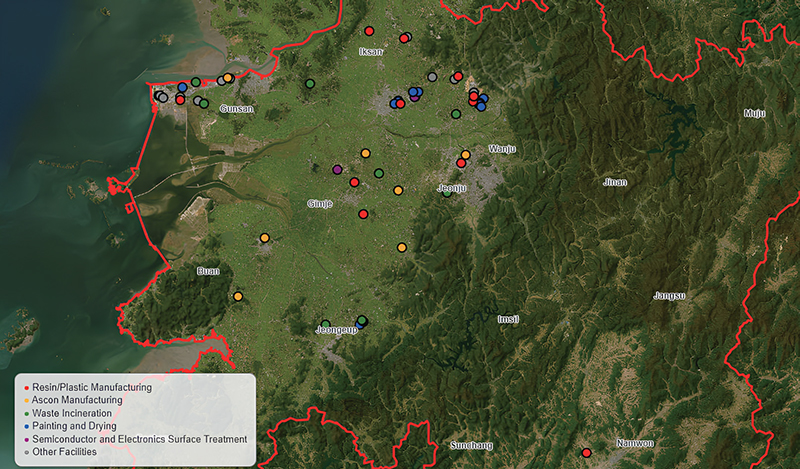
Locations of surveyed stacks from industrial facilities in Jeonbuk State.
분석 항목은 알데하이드류 중 인체 위해성과 민원 발생 가능성이 높은 폼알데하이드, 아세트알데하이드, 프로피온알데하이드, 뷰틸알데하이드를 대상으로 대기오염공정시험기준(Standard Methods for Air Pollution, ES 01501. 1d)에 따라 시료 채취 및 정량 분석하였다. 시료 채취의 경우 대기배출시설과 방지시설이 정상 가동 상태임을 확인한 후, 시료 채취 펌프(MP-Σ100 KN II, SIBATA, Japan)에 DNPH Cartridge(SIBATA, Japan)와 Ozone scrubber(SIBATA, Japan), 가열식 시료 채취관(CP-1, Seil Measurement Technology, Korea)을 직렬로 연결하여 1.0 L min-1, 120°C의 조건으로 10분간 시료 채취하였다. 동일 배출구에 대하여 1일 2회 채취하였으며, 고농도 배출구의 경우 추가로 채취하여 측정값의 재현성을 확인하였다. 또한 파과 여부를 확인하기 위해 DNPH Cartridge 2개를 직렬 연결하여 채취하였으며, 이번 조사에서 파과 사례는 없었다.
DNPH Cartridge에 포집한 시료는 분석 전까지 4°C 이하의 냉암소에 보관하였다. 이후 SPE Vacuum Manifold(VisiprepTM12, Supelco, USA) 및 진공펌프를 이용하여 acetonitrile(J.T.Baker, HPLC Grade)로 최종 부피 5 mL가 되도록 추출하였으며, 추출된 시료의 일부를 2 mL vial에 분취하여 분석 시료로 이용하였다. 분석 시료는 UV/VIS detector가 장착된 고성능액체크로마토그래피(Infinity III HPLC, Agilent, USA)에 C18 Column(Zorbax Eclipse Plus, 4.6×250 mm, 5 μm)을 이용하여 표 2의 조건에서 정량 분석하였다.
HPLC conditions for aldehyde analysis.
알데하이드류 4종의 정도관리는 대기오염공정시험기준에 따라 수행하였으며, 각 물질의 방법검출한계(MDL), 정량한계(LOQ), 정밀도 및 검량선의 결정계수(R2)는 시료 분석과 동일한 조건에서 평가하였고, 그 결과를 표 3에 제시하였다.
Analytical performance characteristics of the DNPH-HPLC method for aldehyde determination.
배출량 산정을 위해 각 배출구별 배출유량, 일일 가동시간, 연간 가동일수 자료를 병행 수집하였다. 배출유량의 경우 대기오염공정시험기준 배출가스 중 굴뚝 배출 시료 채취 방법(Standard Methods for Air Pollution, ES 01114. c)에 따라 배출가스의 온도, 정압, 동압을 측정하고, 수분량 및 밀도를 구한 후, 계산에 의해 배출가스 유속과 유량을 산출하였다. 일일 가동시간과 연간 가동일수는 사업장에서 작성·관리하고 있는 배출시설 및 방지시설 운영기록부를 활용하였다. 일일 배출량은 측정된 알데하이드류 농도에 배출유량과 일일 가동시간을 곱하여 산정하였고, 연간 배출량은 일일 배출량에 연간 가동일수를 적용하여 산정하였다.
업종 간 알데하이드류 농도 및 배출량의 차이를 비교하기 위해 비모수 검정인 Kruskal-Wallis 검정을 하였으며, 유의차가 확인된 경우 Dunn 사후검정을 통해 추가 분석하였다. 모든 통계 분석은 Python(version 3.13.5) 기반으로 수행하였으며, 통계적 유의수준은 0.05로 설정하였다.
3. 결과 및 고찰
3. 1 업종별 알데하이드류 농도 분포특성
본 연구에서는 총 73개 배출구를 대상으로 알데하이드류 4종의 배출특성을 파악하였으며(그림 1), 분석 결과는 표 4에 제시하였다. 업종별·항목별 농도는 최소값과 최대값의 범위가 넓고 평균 대비 표준편차 가 상대적으로 크게 나타나 업종별 농도 분포의 산포 가 컸다. 특히 합성수지 및 플라스틱 제조시설의 아세트알데하이드에서 이러한 경향이 두드러졌으며, 이는 동일 업종 내 일부 배출구에서 상대적으로 높은 농도가 나타났음을 의미한다. 또한 중위값에 비해 평균이 크다는 점(표 4)과 boxplot에서 수염 범위를 벗어난 상방 이상치(upper outlier)가 대부분 업종에서 관찰되는 것이 이러한 경향을 뒷받침해 준다(그림 2).
Summary statistics of aldehyde concentrations by industrial sector.
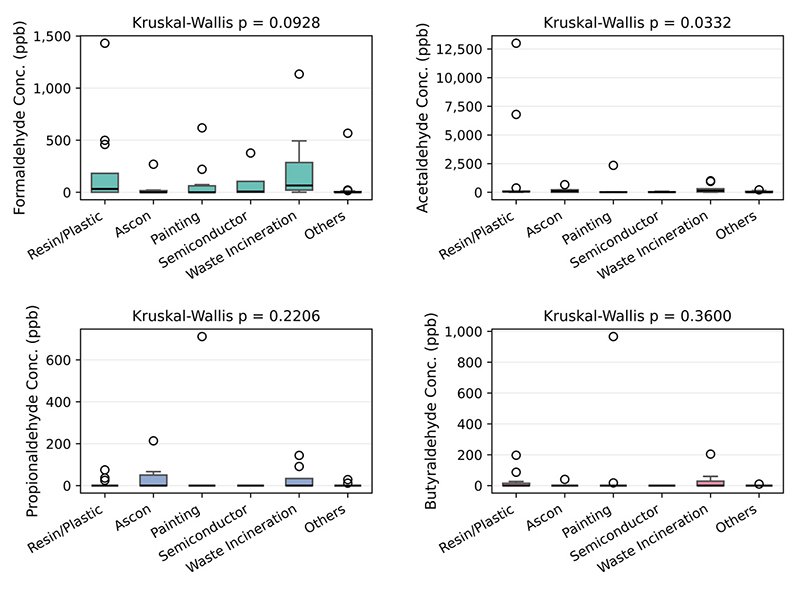
Boxplots of aldehyde concentrations by sector.
업종 간 농도 분포를 중앙값과 사분위 범위를 기준으로 비교한 결과, 대부분의 업종에서 중앙값과 사분위 범위가 상당 부분 중첩되는 경향이 나타났다(그림 2). 이에 대한 통계적 검증으로 Kruskal-Wallis 검정을 수행한 결과, 아세트알데하이드를 제외하고 업종 간 유의한 차이가 나타나지 않았으며(p>0.05), 아세트알데하이드에 대한 Dunn 사후검정에서도 유의한 업종 쌍은 확인되지 않았다. 이는 다수의 불검출 값과 일부 고농도 배출구에 의해 업종 내 분산이 크게 나타났고, 다중비교 보정 과정에서 개별 업종 간 차이가 통계적으로 선명하게 드러나지 않은 결과로 해석된다.
따라서 평균이나 중앙값과 같은 대표값만으로는 업종 간 배출특성을 충분히 설명하기 어렵고, 상단부 고농도 값을 포함한 분포 구조 전반을 함께 고려할 필요가 있다.
3. 2 고농도 중심 분포특성
백분위수 기반 그래프를 통해 업종별 농도 분포를 비교한 결과, 업종 간 차이는 분포의 중앙부보다는 상단부 고농도 구간(upper tail)에서 뚜렷하게 나타났다(그림 3). p50 구간에서는 대부분의 업종이 유사한 수준을 보여 표 4와 그림 2의 중앙값 기반 비교 결과와 일관된 경향을 보였으나, 항목별로 차이가 나타나는 백분위 구간은 다소 달랐다. 다만 모든 항목에서 상위 백분위로 갈수록 일부 업종의 농도 상승이 뚜렷해졌고, 특히 p90 전후에서 업종 간 차이가 가장 크게 확대되었다. 항목별 p90 이상 구간에 해당하는 농도값의 합은 해당 항목 전체 농도 합산값의 70.5~95.8%를 차지하였으며, 이는 업종 간 배출특성 차이가 전체 분포의 중심부보다는 일부 고농도 배출구가 포함된 상단부에서 주로 형성되었음을 보여준다.
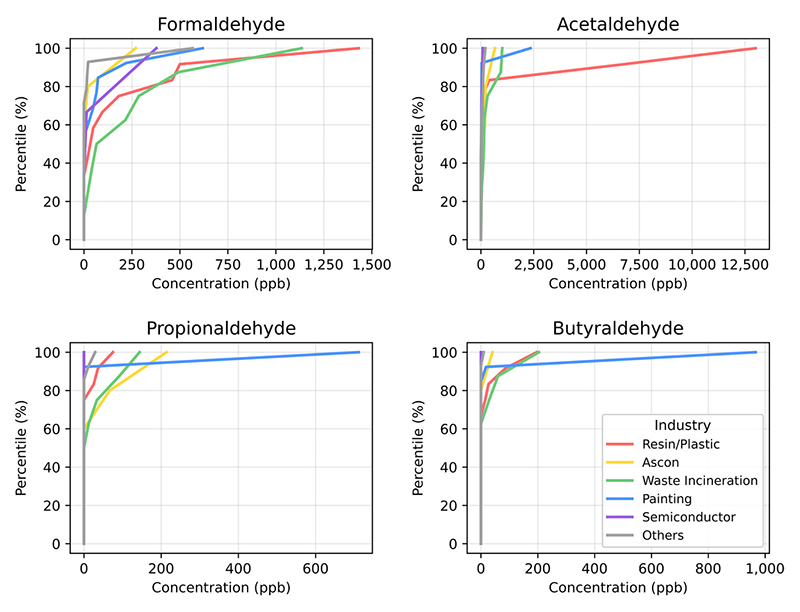
Percentile distributions of aldehyde concentrations across sectors.
특히 합성수지 및 플라스틱 제조시설의 아세트알데하이드는 상위 백분위 구간에서 가장 큰 증가 폭을 보였다. Khemani(1999)는 고분자 소재가 가열 또는 열분해 과정에서 알데하이드류를 생성할 수 있으며, 그 수준은 온도와 처리 조건에 따라 달라질 수 있다고 보고하였다. 본 연구에서 확인된 일부 고농도 사례는 중합 또는 고분자화 공정이 포함된 경우에 나타난 반면, 열성형 중심 공정에서는 상대적으로 낮은 수준을 보였다. 따라서 동일 업종으로 분류되더라도 생산 제품의 종류, 사용 원료의 조성 및 공정 운영특성에 따라 배출특성이 달라질 수 있으며, 이러한 차이가 상단부 농도 분포의 확대로 이어졌을 가능성이 있다.
도장시설 및 부속 건조시설의 경우에도 일부 배출구에서 상대적으로 높은 농도가 나타났다. 이 업종은 도료 계열과 건조 및 경화 조건에 따라 알데하이드류 배출에 영향을 줄 수 있으며, 동일한 도료라고 하더라도 건조 조건과 도막량에 따라 배출특성이 달라질 수 있다(Kim et al., 2011; Chang and Guo, 1998). 본 연구 대상 도장시설은 하도, 상도, 전착 및 습식 도장 후 건조, 분체 도장 후 경화 등 다양한 공정을 포함하고 있다. 그중 고농도 배출구는 유성 도료의 사용 비중이 높고, 건조 또는 경화 공정을 포함한 시설이었다. 이러한 도료 및 공정 조건의 차이가 업종 내 농도 분포의 편차를 키운 것으로 보인다.
아스콘 제조시설, 폐기물 소각처리시설, 반도체 및 전자부품 표면처리시설에서도 상단부 구간의 농도 상승이 확인되었으나, 그 양상은 업종별로 다르게 나타났다. 아스콘 제조시설은 주로 골재 건조 및 가열 공정과 버너의 연소 조건에 의해 영향을 받을 수 있으며(U.S. EPA, 2020), 폐기물 소각처리시설의 경우 처리 대상 폐기물의 조성과 불완전 연소가 발생하는 조건에 따라 배출 편차가 커질 수 있다(Chu et al., 2019). 반도체 및 전자부품 표면처리시설 또한 세정, 식각 공정 등에서 다양한 유기용제가 사용되고 있어 동일 업종 내에서도 배출구별 농도 편차가 나타날 수 있다(Chein and Chen, 2003).
이러한 결과는 관리 우선순위를 정할 때 업종별 대표값 비교만으로 판단하기보다 동일 업종 내 알데하이드류 배출이 집중되는 공정과 배출구를 중심으로 관리할 필요가 있음을 보여준다.
3. 3 연간 배출량 기반 배출 기여 구조와 우세 배출항목
연간 배출량 기준으로 업종별 배출 기여 구조를 비교한 결과, 업종별 배출부하의 차이는 아세트알데하이드에서 가장 뚜렷하게 나타났다(그림 4). 아세트알데하이드는 합성수지 및 플라스틱 제조시설의 기여도가 67.9% (493 kg yr-1)로 가장 높았으며, 이는 현행 규제 대상 업종인 폐기물 소각처리시설의 14.3% (104 kg yr-1)보다 약 4.7배 높은 수준이었다. 또한 아스콘 제조시설에서도 8.3% (60 kg yr-1)의 기여도를 보여 미규제 업종에서도 상당한 배출부하가 확인되었다. 이러한 결과는 아세트알데하이드의 연간 배출부하가 현행 규제 대상 업종에 한정되지 않고 일부 미규제 업종에 편중되어 나타났으며, 그림 2와 그림 3에서 확인된 상단부 고농도 사례가 연간 운영특성과 결합될 경우 실제 배출부하의 확대로 이어질 수 있음을 보여준다. 따라서 아세트알데하이드의 경우 실제 배출부하 기준의 관리 우선순위가 현행 규제 범위와 일치하지 않을 수 있으며, 관리 체계 검토 시 미규제 업종의 배출 기여 또한 함께 고려할 필요가 있다.
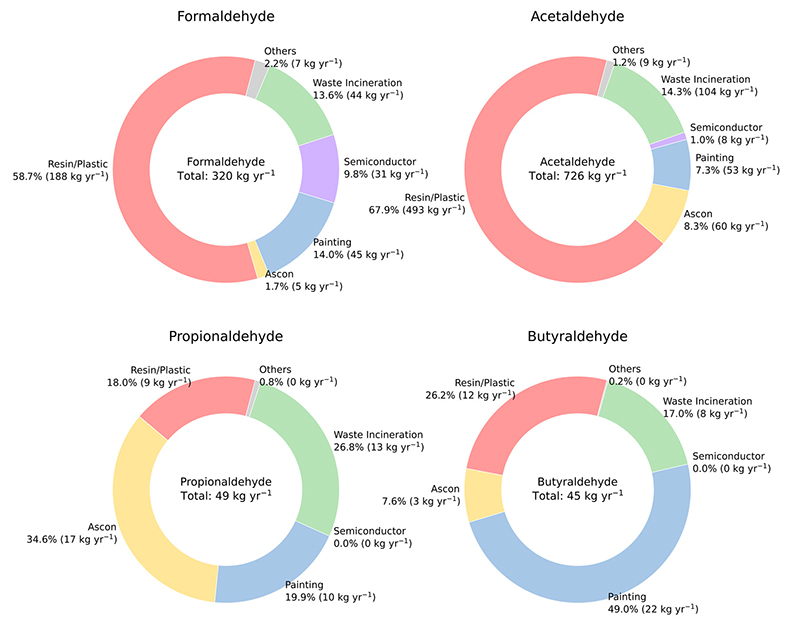
Annual aldehyde emission contributions by sector.
배출 조성 분석에서도 업종별로 뚜렷한 차이가 확인되었다(그림 5). 합성수지 및 플라스틱 제조시설, 아스콘 제조시설, 폐기물 소각처리시설에서는 모두 아세트알데하이드가 전체 알데하이드류 배출량의 약 60~70%를 차지하는 우세 항목으로 나타났다. 반면 반도체 및 기타 전자부품 표면처리시설에서는 폼알데하이드가 80.5%로 가장 높은 비중을 차지하였다. 이는 알데하이드류 배출 조성이 동일한 항목 중심으로 형성되지 않고, 업종에 따라 중점적으로 관리해야 할 항목이 달라질 수 있음을 의미한다. 따라서 총 배출부하가 큰 업종을 우선 관리 대상으로 선정하는 것과 해당 업종 내에서 어떤 알데하이드 항목을 중점적으로 관리할 것인지를 구분하여 검토할 필요가 있다. 이러한 점에서 관리 우선순위는 업종별 총 배출부하만으로 결정하기보다 우세 배출항목을 함께 고려하여 설정하는 것이 적절하다.
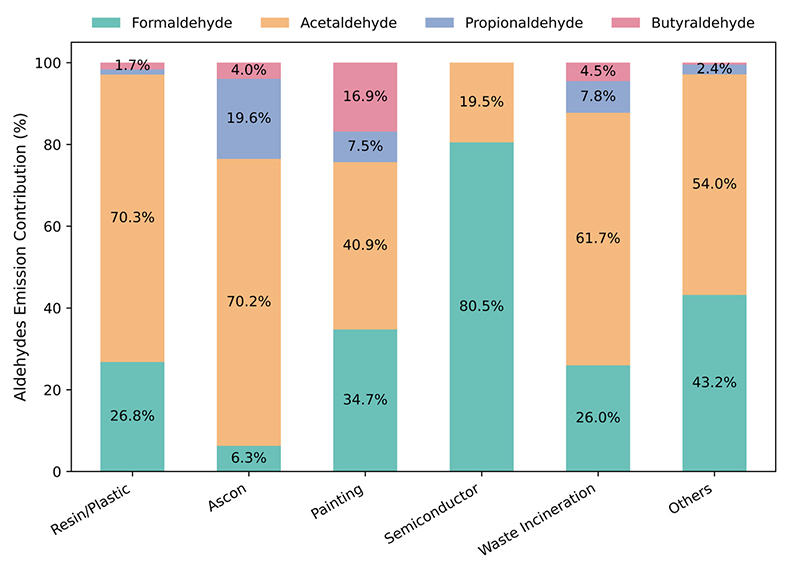
Composition of annual aldehyde emissions by sector.
이에 따라 알데하이드류 모니터링은 업종별 배출부하와 우세 배출항목을 함께 고려하여 측정 대상 업종과 측정 항목을 차등화하는 방향으로 보완될 필요가 있다. 구체적으로 아세트알데하이드의 관리 대상 확대 검토 시 합성수지 및 플라스틱 제조시설과 아스콘 제조시설을 우선 고려하고, 업종별 중점 관리 항목을 설정할 때에는 합성수지 및 플라스틱 제조시설, 아스콘 제조시설, 폐기물 소각처리시설에서 아세트알데하이드를, 반도체 및 기타 전자부품 표면처리시설에서 폼알데하이드를 우선 항목으로 설정하는 것이 타당하다.
다만 본 연구의 연간 배출량은 단일 시점의 농도 측정값과 연간 운영기록을 결합하여 산정한 상대적 지표로서 계절적 변동, 조업 일별 부하 차이 등과 같은 시간적 변동성을 충분히 반영하지 못한다는 한계가 있다. 따라서 절대적인 배출 수준을 정량적으로 해석하는 데에는 제한이 있으며, 측정 시점의 농도 수준에 따라 실제 연간 배출 수준과 차이가 발생할 수 있다. 측정 시점이 저부하 운전, 원료 전환 직후 또는 방지시설 효율이 일시적으로 높은 조건에 해당할 경우 연간 배출량은 실제보다 과소 산정될 가능성이 있으며, 고부하 생산, 고온 건조·가열, 불완전 연소 또는 방지시설 효율 저하 조건에서는 과대 산정될 수 있다. 그러나 동일한 기준을 모든 업종에 일관되게 적용함으로써 업종 간 상대적인 배출부하와 우세 배출항목의 차이를 비교할 수 있었으며, 이를 통해 현행 규제 적용 범위와 실제 배출부하 간 차이를 확인할 수 있었다.
4. 결 론
본 연구는 전북특별자치도 내 56개 사업장, 73개 배출구를 대상으로 알데하이드류 4종의 배출 실태를 실측 자료에 기반하여 분석하고, 업종별 농도 분포와 연간 배출 기여 구조를 함께 검토하였다. 알데하이드류 배출특성은 평균이나 중앙값과 같은 대표값만으로는 충분히 설명하기 어려웠고, 업종 간 차이는 상단부 고농도 구간에서 더 뚜렷하게 나타났다. 연간 배출량 기준으로는 아세트알데하이드에서 일부 미규제 업종의 배출 기여가 규제 대상 업종보다 높았고, 현행 규제 범위와 실제 배출부하 기준의 관리 우선순위 간 차이가 있을 수 있음을 확인하였다. 또한 업종별 우세 배출항목이 서로 달라, 총 배출부하 기준의 관리 대상 선정과 업종별 중점 관리 항목 설정은 구분하여 검토할 필요가 있었다. 이러한 결과는 향후 알데하이드류 관리 체계 검토 시 현행 규제 업종 여부뿐만 아니라 실제 배출부하와 업종별 우세 배출항목을 종합적으로 반영해야 함을 보여준다. 따라서 본 연구는 미규제 업종을 포함한 모니터링 대상 업종 선정, 실제 배출부하를 반영한 관리 우선순위 검토, 그리고 업종별 우세 배출항목에 기반한 중점 관리 항목의 차등 설정을 위한 기초자료로 활용될 수 있다. 다만 본 연구는 전북지역 내 일부 배출시설을 대상으로 한 실측 조사이므로, 조사 결과를 전체 배출시설의 일반적 특성으로 보기에는 다소 제한이 있다. 이를 보완하기 위하여 향후 지역 간 공동연구를 통해 조사 범위를 확대하고 지역별 배출특성 자료를 축적·비교하는 연구가 요구된다.
Acknowledgments
본 논문은 기후에너지환경부의 재원으로 국립환경과학원의 지원(과제번호: 2025-01-03-002)을 받아 수행하였습니다.
References
-
Barua, S., Iyer, S., Kumar, A., Seal, P., Rissanen, M. (2023) An aldehyde as a rapid source of secondary aerosol precursors: Theoretical and experimental study of hexanal autoxidation, Atmospheric Chemistry and Physics, 23, 10517-10532.
[https://doi.org/10.5194/acp-23-10517-2023]

-
Chang, J.C.S., Guo, Z. (1998) Emissions of odorous aldehydes from alkyd paint, Atmospheric Environment, 32(20), 3581-3586.
[https://doi.org/10.1016/S1352-2310(98)00075-2]
-
Chein, H.M., Chen, T.M. (2003) Emission characteristics of volatile organic compounds from semiconductor manufacturing processes, Journal of the Air & Waste Management Association, 53(8), 1029-1036.
[https://doi.org/10.1080/10473289.2003.10466239]
- Cho, D.H., Song, I.S. (2007) Problems of odor prevention law & odor analysis method in South Korea, Korean Journal of Odor Research and Engineering, 6(2), 124-129, (in Korean with English abstract). https://db.koreascholar.com/Article/Detail/239575
-
Chu, X., Fuse, Y., Sasaki, T., Aizawa, I., Oguchi, M., Miyake, Y.(2019) Unexpected aldehyde generation in the exhaust gas at waste incineration facilities, Analytical Sciences, 35(12), 1347-1352.
[https://doi.org/10.2116/analsci.19P234]
-
Do, H., Jung, S. (2020) Contribution analysis by malodor substances from complex odor emission sources in urban industrial area, Journal of Korean Society for Atmospheric Environment, 36(3), 360-374, (in Korean with English abstract).
[https://doi.org/10.5572/KOSAE.2020.36.3.360]
-
Hallquist, M., Wenger, J.C., Baltensperger, U., Rudich, Y., Simpson, D., Claeys, M., Wildt, J. (2009) The formation, properties and impact of secondary organic aerosol: Current and emerging issues, Atmospheric Chemistry and Physics, 9(14), 5155-5236.
[https://doi.org/10.105194/acp-9-5155-2009]
-
Hwang, C.W., Kim, I.G., Kim, S.K., Oh, C.H., Kim, T.H., Jeong, B.H., Kim, J.S. (2018a) A study on the emission characteristics of aldehydes from various industries, Journal of Environmental Health Sciences, 44 (2), 169-177, (in Korean with English abstract).
[https://doi.org/10.5668/JEHS.2018.44.2.169]
-
Hwang, C.W., Song, I.S., Kim, S.K., Oh, C.H., Kim, T.H., Jeong, B.H., Park, E.H., Kim, J.S., Choi, K.C. (2019) A study on the emission characteristics and impact of aldehydes from the printing industry, Journal of Environmental Health Sciences, 45(5), 474-486, (in Korean with English abstract).
[https://doi.org/10.5668/JEHS.2019.45.5.474]
- Hwang, S.Y., Kim, J.H., Lee, S.H., Park, Y.M. (2018b) Odor emission characteristic evaluation of Geomdan General Industrial Complex, The Report of Incheon Metropolitan City Institute of Public Health and Environment, 16, 217-263, (in Korean with English abstract).
- International Agency for Research on Cancer (IARC) (1999) Reevaluation of Some Organic Chemicals, Hydrazine and Hydrogen Peroxide. https://publications.iarc.who.int/Book-And-Report-Series/Iarc-Monographs-On-The-Identification-Of-Carcinogenic-Hazards-To-Humans/Re-evaluation-Of-Some-Organic-Chemicals-Hydrazine-And-Hydrogen-Peroxide-Part-1-Part-2-Part-3-1999, (accessed on May 13, 2026).
- International Agency for Research on Cancer (IARC) (2006) Formaldehyde, 2-Butoxyethanol and 1-tert-Butoxypropan-2-ol. https://publications.iarc.who.int/Book-And-Report-Series/Iarc-Monographs-On-The-Identification-Of-Carcinogenic-Hazards-To-Humans/Formaldehyde-2-Butoxyethanol-And-1-Em-Tert-Em--Butoxypropan-2-ol-2006, (accessed on May 13, 2026).
-
Khemani, K.C. (1999) A novel approach for studying the thermal degradation, and for estimating the rate of acetaldehyde generation by the chain scission mechanism in ethylene glycol based polyesters and copolyesters, Polymer Degradation and Stability, 67(1), 91-99.
[https://doi.org/10.1016/S0141-3910(99)00097-X]
-
Kim, H.J., Park, C.J. (2018) On development of odor control adsorbents using environmental treatment residues, Journal of Odor and Indoor Environment, 17(3), 257-264, (in Korean with English abstract).
[https://doi.org/10.15250/joie.2018.17.3.257]
-
Kim, J.A., Kim, S., Kim, H.J., Kim, Y.S. (2011) Evaluation of formaldehyde and VOCs emission factors from paints in a small chamber: The effects of preconditioning time and coating weight, Journal of Hazardous Materials, 187(1-3), 52-57.
[https://doi.org/10.1016/j.jhazmat.2010.10.094]
-
Kim, S.H., Park, C.J., Lee, Y.S. (2021) A study of recent research trends on the control of aldehydes in designated odor compounds in Korea, Journal of Odor and Indoor Environment, 20(4), 275-287, (in Korean with English abstract).
[https://doi.org/10.15250/joie.2021.20.4.275]
-
Lee, J.Y., Jung, S.H. (2020) Odor characteristics and deodorization process improvement in mechanical biological treatment and solid refuse fuel plant, KSFM Journal of Fluid Machinery, 23(4), 54-60, (in Korean with English abstract).
[https://doi.org/10.5293/kfma.2020.23.4.054]
- Ministry of Climate, Energy and Environment (MCEE) (2025a) Clean Air Conservation Act. https://www.law.go.kr/LSW/lsInfoP.do?ancYnChk=0&chrClsCd=010202&efYd=20251111&lsiSeq=279785&urlMode=lsInfoP, (accessed on May 13, 2026).
- Ministry of Climate, Energy and Environment (MCEE) (2025b) Malodor Prevention Act. https://law.go.kr/LSW//lsInfoP.do?lsiSeq=276767&ancYnChk=0&ancNo=21065&efYd=20251001&nwJoYnInfo=Y&efGubun=Y&chrClsCd=010202&ancYnChk=0#0000, (accessed on May 13, 2026).
- Ministry of Climate, Energy and Environment (MCEE) (2026) Enforcement Decree of the Clean Air Conservation Act. https://www.law.go.kr/LSW/lsInfoP.do?ancYnChk=0&chrClsCd=010202&efYd=20260324&lsiSeq=284715&urlMode=lsInfoP, (accessed on May 13, 2026).
-
Ruth, J.H. (1986) Odor thresholds and irritation levels of several chemical substances: A review, Journal of the Air Pollution Control Association, 36(9), 1068-1075.
[https://doi.org/10.1080/00022470.1986.10466177]
- Texas Commission on Environmental Quality (TCEQ) (2014) Development support document: n-Butyraldehyde. https://www.tceq.texas.gov/downloads/toxicology/dsd/final/butyraldehyde.pdf, (accessed on Feb. 20, 2026).
- U.S. Environmental Protection Agency (U.S. EPA) (2008) Toxicological review of propionaldehyde. https://iris.epa.gov/static/pdfs/1011tr.pdf, (accessed on Feb. 20, 2026).
- U.S. Environmental Protection Agency (U.S. EPA) (2020) AP-42, Hot Mix Asphalt Plants. https://www.epa.gov/sites/default/files/2020-10/documents/c11s01.pdf, (accessed on Apr. 9, 2026).
-
Woo, E.J., Park, C.J. (2017) On the control of odor and VOCs in a living system with the application of wastes, Journal of Odor and Indoor Environment, 16(4), 369-374, (in Korean with English abstract).
[https://doi.org/10.15250/joie.2017.16.4.369]
김도훈(전북특별자치도보건환경연구원 대기환경연구부 대기환경과 환경연구사) (kdh1013@korea.kr)
김종신(전북특별자치도보건환경연구원 대기환경연구부 대기환경과장) (newsys@korea.kr)
김미파(전북특별자치도보건환경연구원 대기환경연구부 대기환경과 환경연구사) (mpmini07@korea.kr)
홍해진(전북특별자치도보건환경연구원 대기환경연구부 대기환경과 환경연구사) (hhj123@korea.kr)
최근화(전북특별자치도보건환경연구원 대기환경연구부 대기환경과 환경연구사) (choigh12@korea.kr)
김효윤(전북특별자치도보건환경연구원 대기환경연구부 대기환경과 환경연구사) (soom154@korea.kr)
유재연(전북특별자치도보건환경연구원 대기환경연구부장) (giantu@korea.kr)
전경식(전북특별자치도보건환경연구원장) (kschon17@korea.kr)