
고정밀 온실가스 산출을 위한 HITRAN 및 ABSCO 데이터베이스의 단파 적외선 CO2 및 H2O 흡수선 비교

Copyright © 2026 Korean Society for Atmospheric Environment
This is an Open Access article distributed under the terms of the Creative Commons Attribution-NoDerivatives 4.0 International (CC BY-ND 4.0) License, which permits copying and redistribution in any medium or format, provided the original work is properly cited. The License does not permit modification, adaptation, translation, transformation, or the creation of derivative works.
Abstract
To precisely measure global carbon sinks and sources, greenhouse gas monitoring satellites require a carbon dioxide (CO2) accuracy better than 1%. However, uncertainties in greenhouse absorption lines remain a major source of error in achieving this goal. This study compares the most widely used ABSorption COefficient (ABSCO) version 5.2 and the recently released HIgh-resolution TRANsmission (HITRAN) 2024 gas absorption databases, focusing on the high-resolution line features of CO2 and water vapor (H2O) in the shortwave infrared wavelengths. To account for complex absorption-related physical phenomena, including collisional line-mixing, both the Voigt and the quadratic speed-dependent Voigt/Rautian models were employed. Although both data sets agree well under typical surface-level conditions, systematic differences are observed in the weak (1.6 µm) and strong (2.1 µm) CO2 absorption bands in the upper atmosphere. Under highly humid conditions, HITRAN2020 and earlier HITRAN databases showed previously reported discrepancies, primarily due to the absence of a water vapor continuum model. However, HITRAN2024 displayed lower spectral deviations with patterns similar to those in the ABSCO table, which is largely attributable to HITRAN2024’s recent inclusion of the water vapor continuum model and improved broadening parameters. In the quantitative comparison between HITRAN2024 and the ABSCO table, the Voigt model demonstrated greater consistency than the non-Voigt model. Meanwhile, the CO2 spectrum exhibited discrepancies at high-altitude conditions, where pressure, temperature, and air density decrease. The spectroscopic deviation increased from approximately 3.1% at the surface to 7.9% in the upper troposphere when convolved with the OCO-2 slit function. These findings demonstrate that the integrated optimization of the water vapor continuum model and individual line parameters is crucial for high-precision atmospheric retrievals.
Keywords:
HITRAN, ABSCO, Spectroscopy, Greenhouse gas, Satellite remote sensing1. 서 론
산업혁명 이후 대기 중 이산화탄소(CO2) 농도는 지속적으로 증가해 왔으며, 이는 심각한 지구 온난화의 원인이 되고 있다. 지난 수십 년 동안 지구 온난화의 주요 원인인 CO2를 지속적으로 모니터링하기 위해 GOSAT(Greenhouse Gases Observing Satellite; Hamazaki et al., 2005), GOSAT-2(Imasu et al., 2023), OCO-2(Orbiting Carbon Observatory-2; Crisp et al., 2017; Eldering et al., 2017), OCO-3(Eldering et al., 2019) 등 다양한 위성이 기후 연구에 있어 필수적인 도구로 자리 잡았다. 이러한 광범위한 모니터링에도 대기 중 0.3%의 변동성에 대해 1 ppm 미만의 정확도라는 엄격한 요구 사항을 충족하는 것은 여전히 주요한 과제로 남아 있다(Crisp et al., 2017, 2004; Thompson et al., 2012).
인공위성의 높은 산출 정확도를 달성하는 데 있어 불확실성 요인은 주로 온실기체의 흡수 단면적 데이터베이스, 대기 산란, 지표기압 등이 있다(Hobbs et al., 2020; Frankenberg et al., 2015). 이 중에서도 기체의 흡수 단면적 정보의 오차를 이해하기 위해, 본 연구에서는 CO2 산출 알고리즘에서 가장 널리 사용되는 데이터인 ABSorption COefficient(ABSCO) 테이블과 HIgh-resolution TRANsmission(HITRAN) 데이터베이스를 비교하고자 한다. ABSCO 테이블은 계산 비용을 줄이기 위해 조견표(Look-Up Table; LUT) 형태로 구축되었으며, 최근 버전에서는 기존 Voigt 선형 모델에 의한 W-자형 잔차 및 수증기 연속 흡수대에서의 불확실성으로 인한 기압 편향 등이 선형 모델과 최신 수증기 연속 흡수대의 도입을 통해 개선된 바 있다(Payne et al., 2020; Thompson et al., 2012). 그 가운데, 기존의 Voigt 선형 모델에서 고려하기 어려운 선 혼합 및 속도 의존 효과와 같은 복잡한 물리적 현상 또한 포함되었다. ABSCO 버전 5.2(v5.2)에서는 강한 CO2 밴드(Strong CO2; SCO2)에서 개별 흡수선의 선폭 확장과 이동, 흡수선 간의 선 혼합 현상을 설명하는 이완 행렬을 적용하여 이러한 효과를 더욱 개선하였다(Payne and Oyafuso, 2022).
반면, HITRAN 데이터베이스는 자외선(Ultraviolet, UV)에서 적외선(Infrared, IR) 영역에 걸쳐 Line-by-Line(LBL) 계산에 필요한 매개변수를 제공한다. 이러한 범용적인 변수 제공은 다양한 열역학적 대기 조건하에서 고해상도 스펙트럼 데이터를 제공한다(Gordon et al., 2022, 2017). 특히 최근 출시된 HITRAN 2024년도 버전(HITRAN2024)은 대기 중 온실가스 흡수에 대한 정밀도가 크게 향상되어 불확실성이 0.1% 미만으로 보고되었다(Gordon et al., 2026).
이러한 두 데이터는 근본적으로 다른 목적을 가지고 개발되었다. HITRAN은 일반적인 대기 복사 전달 모델링을 위해 물리적으로 검증된 스펙트럼 매개변수들을 종합적으로 제공하는 것을 목표로 하는 반면, ABSCO 테이블은 위성 알고리즘에서 CO2 건조 대기 몰분율(XCO2) 산출 시 발생하는 체계적인 편향을 줄이기 위해 설계되었고 경험적인 보정항이 곱해진다. 이렇게 다른 목적으로 개발된 두 데이터는 고도에 따른 기압 및 온도 변화와 같은 다양한 조건에서 차이가 날 수 있으며, 이들을 활용하는 위성 알고리즘의 성능 차이로 이어질 수 있다. 또한 정확도가 향상된 HITRAN2024와 ABSCO v5.2 데이터가 최근 출시됨에 따라, 신뢰도 높은 온실가스 산출 알고리즘을 개발하기 위해서는 이들에 대한 면밀한 분석이 필수적이다. 따라서 본 연구는 온실가스 산출 정확도 향상을 위해 ABSCO v5.2 테이블과 HITRAN2024 데이터베이스 간의 CO2 및 H2O 흡수 단면적을 비교 분석하고자 한다(Gordon et al., 2026; Payne and Oyafuso, 2022; Payne et al., 2020).
2. 연구 방법
2. 1 ABSCO 테이블
높은 정확도와 계산 효율성을 고려한 ABSCO 테이블은 64개의 압력 격자 각각에 17개의 온도 격자와 3개의 H2O 부피 혼합비(Volume Mixing Ratio, VMR) 격자로 구성된다(Payne and Oyafuso, 2022; Payne et al., 2020). 이 테이블은 OCO-2/3 임무에서 사용되는 근적외선(Near IR) 대역을 포함하며, 특히 O2A 밴드(0.76 µm)와 약한 CO2 밴드(Weak CO2, WCO2; 1.61 µm) 및 강한 CO2 밴드(Strong CO2, SCO2; 2.06 µm)로 나뉜다. 이러한 고해상도 테이블은 각 밴드 내의 개별 흡수 특징을 정밀하게 모사한다(Payne and Oyafuso, 2022; Crisp et al., 2017).
본 연구에 활용된 ABSCO v5.2는 기존에 사용되던 인접 선들과의 상호작용만을 계산하는 최근접 근사법에서 개별 선과 모든 선의 상호작용을 계산하는 이완 행렬을 도입하여 분광학적 구조를 더욱 정교하게 개선하였다(Payne and Oyafuso, 2022). 이러한 물리적 모델링의 개선에도 불구하고, 여전히 흡수선 강도에 1% 내외의 불확실성 및 이를 포함한 계통 편향이 남아 있다(O’Dell et al., 2018). 보다 신뢰성 높은 XCO2를 산출하고 밴드 간 일관성을 확보하기 위해, 최종적으로 지상 원격탐사 관측망인 Total Column Carbon Observing Network (TCCON) 측정값으로부터 도출된 경험적 보정항이 적용된다(Payne and Oyafuso, 2022; O’Dell et al., 2018). 이러한 방식을 통해 OCO-2/3의 산출값은 지상 관측망과의 높은 일관성을 보이며 데이터의 신뢰성이 확보되었다. 본 연구에서는 ABSCO 테이블의 특징을 기반으로, 사전 정의된 격자상에서 선형 보간법과 보정항을 적용하는 방식을 취하였다.
2. 2 HITRAN 데이터베이스
1970년대 미국 공군 연구소에서 대기 흡수선이 처음 구축된 이후(McClatchey et al., 1973), HITRAN은 분자 흡수 매개변수 데이터베이스를 제공해 왔다. 흡수선 선형 모델링의 발전으로 HITRAN2016 버전에는 속도 의존 및 Hartmann-Tran (HT) 프로파일 매개변수가 처음 제공되었다(Gordon et al., 2026, 2022, 2017; Tennyson et al., 2014). HT 모델은 스펙트럼 정확도를 크게 향상시켰지만, 온도 의존성 및 혼합 기체 모델의 복잡성으로 인해 특정 파장 대역에서 수치적 특이성이 보고되었다(Wcisło et al., 2025). 이러한 문제를 해결하기 위해 최신 버전(HITRAN2024)에서는 modified HT (mHT) 프로파일 매개변수를 도입하였다. mHT 프로파일은 매개변수를 실수부와 허수부로 분리하여 계산 안정성과 실용성을 유지하였다(Gordon et al., 2026; Wcisło et al., 2025). 또한 선형 모델을 더욱 향상시키기 위해 최근에는 공기에 의한 선폭 확장 및 동위원소 의존 확산 매개변수가 포함되었다(Gordon et al., 2026, 2022, 2017).
일반적으로는 mHT 프로파일이 가장 권고되는 선형 모델이지만, 이를 완전히 활용하려면 복소수 공간에서 딕 좁아짐(Dicke narrowing) 매개변수와 같은 확장된 선형 모델 매개변수 데이터가 필요하며, 현재 이러한 매개변수는 H2와 같은 일부 가벼운 분자에 대해서만 사용할 수 있다(Gordon et al., 2026; Wcisło et al., 2025). H2O 및 CO2와 같은 무거운 분자의 경우, 확장된 매개변수의 가용성은 스펙트럼 대역에 따라 달라진다. 가스 흡수선 비교에 있어 정확도를 극대화하기 위해, 본 연구에서는 단일 모델을 적용하는 대신 각 흡수선별 최적화된 프로파일을 적용한다. 구체적으로는 각 매개변수에 2차 속도 의존형 Rautian (quadratic Speed-Dependent Rautian, qSDR) 또는 Voigt (quadratic Speed-Dependent Voigt, qSDV) 모델을 적용한다. 충돌 계수가 제공되는 경우, qSDR 모델을 사용하여 1596.65 nm 부근의 딕 좁아짐 현상을 반영하였으며, 그 외 1593.42~1621.70 nm 구간에서는 주로 qSDV 모델을 활용하였다. 또한, 인접한 선들 사이의 충돌 간섭을 고려하기 위해, 특정 파장 대역(1593.00~1622.00 nm 및 2047.01~2083.00 nm)에 대해 선 혼합 매개변수를 적용하였다.
고정밀 복사 전달 모델의 경우, 기존의 독립적인 흡수선을 가정하는 Voigt 선형 모델은 선 혼합 및 속도 의존과 같은 복잡한 효과를 무시하기 때문에 불확실성을 초래할 수 있다. 따라서 본 연구에서는 HITRAN 기반 계산의 정확도를 향상시키기 위해 Voigt 선형 모델에서 발전된 선형 모델을 채택하며, 구체적인 수학적 산출 공식 및 구조는 2.3절에 상세히 기술하였다(Mendonca et al., 2019; Tran et al., 2013; Thompson et al., 2012).
2. 3 HITRAN 계산을 위한 선형 모델
ABSCO 테이블은 선 혼합, 속도 의존 효과, 수증기에 의한 선폭 확장 등 물리적 상호작용을 포함하는 반면, 기존의 Voigt 프로파일은 이러한 물리적 과정을 충분히 반영하지 못한다는 한계가 있다(Tennyson et al., 2014; Ngo et al., 2013; Tran et al., 2013). 이러한 제약으로 인해 International Union of Pure and Applied Chemistry (IUPAC)에서는 표준 흡수 선형 모델로 HT 프로파일을 권장한다(Tennyson et al., 2014; Ngo et al., 2013). 그러나, HT 원형 모델은 혼합 기체를 고려할 때 수치적 불안정성을 야기할 수 있으며(Wcisło et al., 2025), 일부 매개변수의 가용성 또한 모든 조건에서 충분하지 않다.
이에 본 연구는 수치적 안정성을 개선하기 위해, qSDR 및 qSDV 모델을 포괄하는 mHT 모델을 채택하였다. 이러한 하위 모델들을 통합한 mHT 프로파일(ImHT(ν))은 Wcisło et al. (2025)이 제시한 바와 같이 다음 식 (1)로 표현된다:
| (1) |
수식 (1)로부터, 𝜈r,opt와 𝜈i,opt는 각각 딕 좁아짐 매개변수의 실수부와 허수부를 나타낸다. 물리적으로, 𝜈r,opt는 속도 변화 충돌의 빈도를 반영하며, 𝜈i,opt는 속도 변화 충돌과 위상 변화 사이의 상관관계를 나타낸다(Wcisło et al., 2025). 또한 는 qSDV 프로파일로, 이는 복소 확률 함수인 𝑤(𝑧)의 조합을 통해 다음과 같이 해석적으로 표현된다:
| (2) |
여기서 𝑤(𝑧)는 Faddeeva 함수로 알려진 복소 확률 함수로, 프로파일 모델의 정확도를 유지하면서도 계산 비용을 최소화한다(Boone et al., 2007). 𝑤(𝑧)는 복소 공간에서의 적분을 포함하므로, 본 연구에서는 수치 효율성을 확보하기 위해, 선의 중심부(line center)에서는 16개 항의 유리 함수 근사식을 적용하고, 날개 영역(Far wings)으로 갈수록 점근 근사식과 결합되는 방식을 취하였다. 이 방법은 기존의 HumlÍček 알고리즘을 확장하여, 복소평면 전역에서 10-5 이하의 상대 오차를 달성한다. 결과적으로, 이러한 정밀도 향상을 통해, 기존 12개의 항 모델이 필수적으로 요구하던 계산상의 조건부 분기 없이도 안정적으로 계산된다(Schreier and Hochstaffl, 2021; Schreier, 2018; HumlÍček, 1979):
| (3) |
𝑎𝑘항과 𝑏𝑙항은 각각 분자와 분모의 다항식에 최적화된 상수를 나타내며, 상세한 계수 값은 Schreier (2018)에 수록되어 있다. 또한, 식 (3)의 복소 인자 𝑧는 변수 𝑋와 𝑌를 사용하여 정의된 물리적 매개변수 𝑍±를 취한다 (Ngo et al., 2013; Tran et al., 2013):
| (4) |
여기서 변수 𝑋와 𝑌는 미시적인 충돌과 도플러 효과를 포함하며, 다음과 같이 나타난다:
| (5) |
식 (5)로부터, 𝜈𝐷, 𝜈𝜈, 𝜈0는 각각 도플러 선폭, 빛의 진동수, 기존 흡수선의 위치를 의미한다. 복소 상수 𝐶0와 𝐶2는 속도 평균 및 속도 의존 항을 나타내며, 각각 선폭 확장과 선 위치 이동 매개변수를 포함한다.
개별 흡수선 프로파일의 최적화된 선형 모델은 높은 계산 효율을 보장하지만, 온실가스 관측 임무에 요구되는 수준의 엄격한 정확도를 달성하기 위해서는 선 혼합 효과를 반드시 고려해야 한다(Thompson et al., 2012; Miller et al., 2005). 압력에 의한 충돌 결합은 대기 하부 대류권에서 강하게 나타나는데, 특히 전이 간격이 조밀한 근적외선 CO2 밴드(1.61 ㎛ 및 2.06 ㎛)에서는 각 흡수선을 독립적인 특징으로 취급하기 어렵다(Thompson et al., 2012; Hartmann et al., 2009). 그러므로, 대기 중 CO2 스펙트럼의 변형을 정확히 반영하기 위해, 개별 프로파일을 1차 Rosenkranz 선 혼합 매개변수 𝑌𝐿𝑀를 사용하여 비대칭 성분과 선형 결합해야 한다. 이는 수학적으로 복소 프로파일 𝐼𝑚𝐻𝑇에 (1 − 𝑖𝑌𝐿𝑀) 항을 곱한 후 실수부를 취함으로써 효율적으로 구현된다(Wcisło et al., 2025; Ngo et al., 2013; Rosenkranz, 1975):
| (6) |
정규화된 프로파일 Ifinal는 식 (6)을 통해 얻어지며, 물리적 흡수 단면적은 여기에 강도를 곱하여 산출된다. 결론적으로, 표준 Voigt 모델에서 근본적인 충돌 효과를 반영한 최적화된 흡수 선형 모델로의 전환을 통해, 위성 임무에 필수적인 복사 정확도와 최적의 계산 성능을 모두 확보하였다(O’Dell et al., 2018; Crisp et al., 2012).
3. 결과 및 고찰
3. 1 역대 HITRAN 데이터와 ABSCO 테이블 간의 비교 분석
본 절에서는 HITRAN 데이터베이스의 Voigt 및 다양한 선형 모델(non-Voigt; Wcisło et al., 2016; Tennyson et al., 2014)로 계산된 기체 흡수선과 ABSCO 테이블의 기체 흡수선을 WCO2 및 SCO2 밴드에서 비교한다. 최근 분광학적 업데이트의 영향을 이해하기 위해서는 이전 HITRAN 버전과 비교하여 흡수 단면적의 변화를 살펴야 한다. 그림 1은 2016년부터 2024년까지의 HITRAN 버전을 ABSCO v5.2 데이터와 비교하여 보여주며, V는 표준 Voigt 프로파일을 나타내고, nonV는 발전된 non-Voigt 모델을 나타낸다. 수증기 확산과 연속체 흡수가 CO2 선에 미치는 복합적인 영향을 파악하기 위해서는 H2O VMR을 0.03 (3%)으로 설정하여 매우 습한 조건을 가정해야 한다(Lamouroux et al., 2015). 이러한 조건에서 HITRAN 데이터베이스에서 도출된 흡수 단면적은 흡수가 약한 구간에서 ABSCO 테이블의 값보다 더 낮다(Thompson et al., 2012).
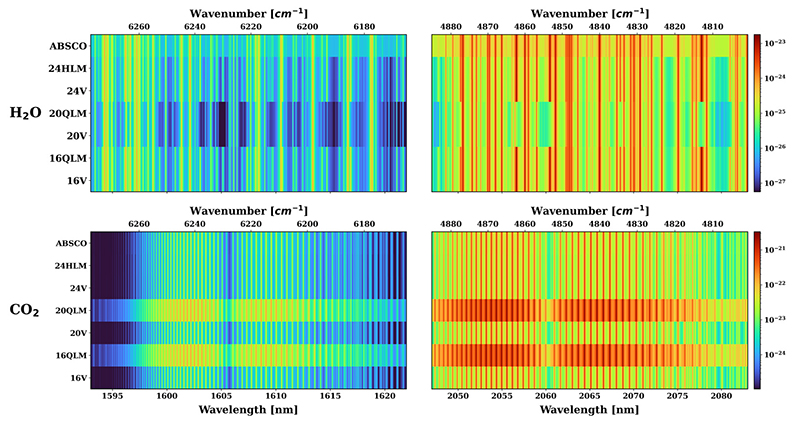
Comparison of absorption cross-sections across different HITRAN versions and ABSCO v5.2. The panels are organized by gas species (H2O and CO2), with columns for target Weak CO2 (WCO2) and Strong CO2 (SCO2) bands. The development of spectroscopic models from HITRAN 2016 to 2024 is shown along the y-axis of each panel. To show both strong and weak transitions, the absorption intensities are displayed on a logarithmic scale (color bars on the right). Here, ‘V’ indicates the standard Voigt profile. The label ‘nonV’ refers to the advanced non-Voigt models.
CO2 패널에서 볼 수 있듯이, 초기 HITRAN 버전(16nonV 및 24nonV)에서 선 혼합을 포함하면 ABSCO 표에 비해 상당히 과대평가되는 결과가 나타났다. 한편, 그림 1의 H2O 단면적은 다른 버전과 비교했을 때 HITRAN2020에서 뚜렷한 차이점을 보인다. 이러한 특징은 4340 cm-1 이상에서 관측된 분광학적 매개변수인 선 위치 및 압력 유도 이동의 오차와 관련이 있으며, 이는 Gordon et al. (2026)이 데이터베이스에서 보고한 바 있다. 그림 1은 최근 분광학적 업데이트에 대한 개괄적인 정보를 제공하지만, 위성 기반 모니터링에 필요한 1% 미만의 정확도를 달성하려면 더욱 정밀한 비교가 필요하다(Thompson et al., 2012; Crisp et al., 2004). 그러므로 다음 절에서는 최신 버전(HITRAN 2024 및 ABSCO 5.2)을 사용하여 고해상도 개별 선의 분석을 수행한다.
3. 2 다양한 대기 조건에 따른 최신 HITRAN 데이터와 ABSCO 테이블 비교 분석
본 절에서는 HITRAN2024와 ABSCO v5.2 간의 일관성을 평가하기 위해 고해상도 개별 선 비교를 수행하였다. 그림 2로부터, 표면 조건(296 K, 1013.25 hPa, H2O 농도 1%)에서의 HITRAN2024 CO2 및 H2O 흡수선은 ABSCO v5.2 데이터와 높은 일치를 보인다. H2O 분자의 경우 ABSCO는 HITRAN2024에 비해 약 10-25 cm2/molecule 높은 값을 도출했다. 이 결과는 기저선 레벨에서 차이를 유발하지만 스펙트럼 피크는 정확히 일치하는 것에서 기인했다.
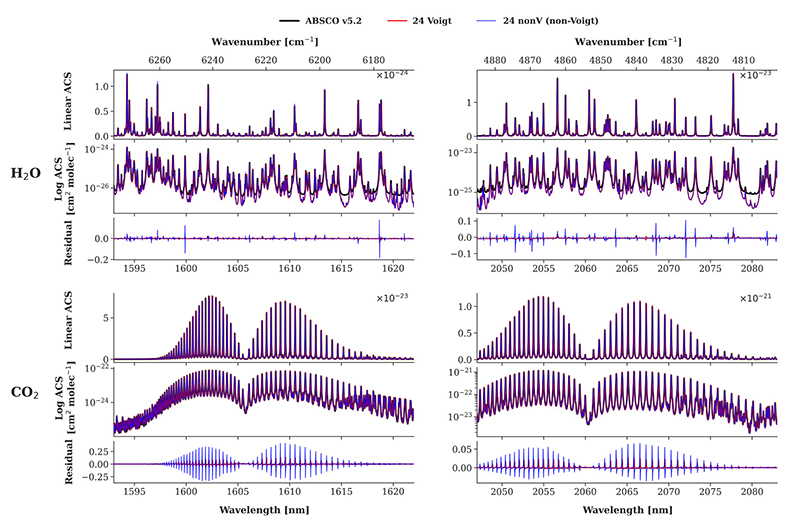
Spectral comparisons between HITRAN24 using the Voigt model (red), HITRAN24 with the non-Voigt model (blue), and ABSCO data (black) under standard conditions (296 K, 1013.25 hPa, and H2O concentration of 1%). The left and right columns display CO2 and H2O, respectively, for the WCO2 and SCO2 bands. Each panel contains three subplots: linear-scale absorption cross-section (ACS) (top), log-scale ACS (middle), and spectral residual (model-ABSCO v5.2). Notably, both CO2 and H2O species exhibit comparable spectral characteristics and consistent residual patterns across the target bands.
특히, 그림 2에서 비교한 바와 같이 Voigt 모델은 non-Voigt 모델보다 ABSCO 테이블과 더 높은 일관성을 보였다. HITRAN Voigt 모델과 ABSCO 테이블 간의 평균 제곱근 편차(Root-Mean-Square-Deviation, RMSD) 값은 WCO2 밴드의 경우 1.35×10⁻²⁵, SCO2 밴드의 경우 3.76×10⁻²⁴으로 나타난 반면, HITRAN의 non-Voigt 모델은 ABSCO 데이터와 비교했을 때 5.36×10⁻²⁵(WCO2) 및 8.55×10⁻²⁴(SCO2)의 더 높은 RMSD 값을 나타냈다. 전체 RMSD는 데이터의 일관성을 보여주는 전역적인 지표로 활용되지만, 이는 흡수 피크와 밸리에서의 국지적 편차를 보여주는 그림 2의 상세 흡수선 분석을 통해 상호 보완적으로 해석되어야 한다. 이러한 미세한 잔차를 해결하는 것은 매우 정확한 위성 데이터 추출에 필수적이기 때문에(Frankenberg et al., 2015; Tennyson et al., 2014; Thompson et al., 2012), 본 연구는 다양한 대기 조건에 대한 이러한 잔차의 민감도를 체계적으로 평가하였다.
CO2 산출을 위한 일반적인 복사 전달 모델은 대기 하층에서 상층까지 압력과 온도가 변하는 1차원 층을 가정한다. 선형 모델의 편향은 주로 충돌 상호작용에서 발생하며, 이는 본질적으로 열역학적 조건에 따른 선형의 민감도를 이해해야 함을 의미한다(Hobbs et al., 2020; Tennyson et al., 2014). 또한, 계산된 흡수선에서 관찰되는 미세한 잔차는 대부분 고려되지 않은 충돌 상호작용에 의해 좌우된다(Tennyson et al., 2014; Thompson et al., 2012). 그 과정에서 발생하는 선폭 확장의 크기는 기체 압력에 비례하기 때문에(Ngo et al., 2013; Thompson et al., 2012), 다양한 고도에 걸쳐 스펙트럼 변화를 평가하는 것이 필수적이다.
그림 3은 다양한 고도에서 HITRAN 및 ABSCO 데이터의 CO2 흡수선 예시를 보여주며, 각각 100, 500, 900, 1013.25 hPa에서 계산되었다. 충돌 및 선 혼합 효과가 지배적인 지표면 조건(1013.25 hPa)에서 모든 데이터에서 피크가 낮고 선폭이 넓은 로렌츠 분포 형태가 나타나는 반면, 도플러 확장 효과가 지배적인 상층 대기 조건(100 hPa)에서 피크가 높고 선폭이 좁은 가우시안 분포 형태가 나타난다. 이는 고도에 따른 기압 감소 시 관찰되는 선폭 확장의 일반적인 이론 양상과 잘 일치한다. 특히 선 강도가 보존되는 물리적 원리에 의해 선폭이 좁아질수록 피크의 높이는 급격히 상승하게 되며, 전 고도 구간에서 ABSCO v5.2와 HITRAN 2024 (Voigt 및 non-Voigt) 데이터가 높은 수준의 일관성을 보이는 결과는 최신 분광 데이터베이스 간의 긴밀한 물리적 유사성을 반영한다.
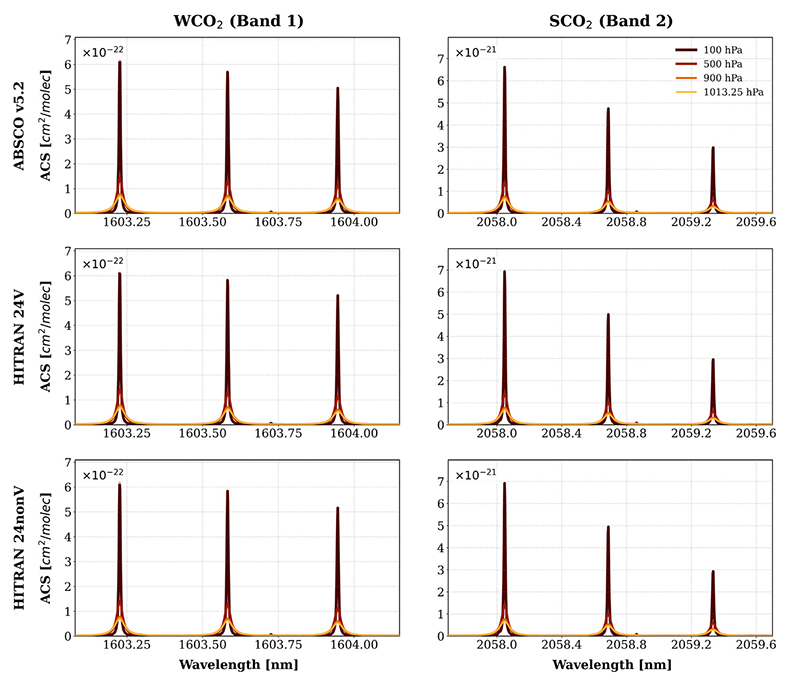
Absorption cross-section of CO2 from the ABSCO v5.2 and HITRAN 2024 (Voigt and 24 non-Voigt models) database for the WCO2 and SCO2 bands at 1% H2O VMR. Different colors indicate different atmospheric altitudes.
그림 4는 WCO2 및 SCO2 대역 내 모든 파장에 걸쳐 HITRAN 2024 스펙트럼(y축)과 ABSCO 테이블(x축)을 비교한 그림이며, 각 열은 서로 다른 고도 조건(100, 500, 900 및 1013.25 hPa)을 나타낸다. 그림 3에서 논의된 바와 같이, 고도가 높아질수록 수치적인 잔차값이 커지기는 하지만, 정성적으로는 전 고도에서 HITRAN 데이터베이스와 ABSCO 테이블이 잘 일치한다. 전반적으로 HITRAN과 ABSCO 데이터베이스의 H2O 흡수선은 유사한 경향을 보이지만, CO2 흡수선보다 더 복잡하게 나타난다. 이는 모든 고도 조건에서 흡수선의 피크와 밸리 모두 비선형 관계를 나타낸다는 점에서 확인할 수 있다. CO2의 경우 대기 상층 조건에서 대기 하층보다도 큰 편차를 보였는데, 이러한 점은 도플러 편향이 지배적인 환경에서 열적 운동을 물리적으로 모사하는 방식에 있어 두 데이터 간의 파라미터화 방식 차이가 하층보다 상층에서 더 민감하게 나타나는 것으로 보인다. 또한 분석 결과, 대부분의 고도 조건에서 Voigt 모델 기반의 CO2 및 H2O 흡수선이 non-Voigt 모델보다 상대적으로 낮은 RMSD를 보였다.
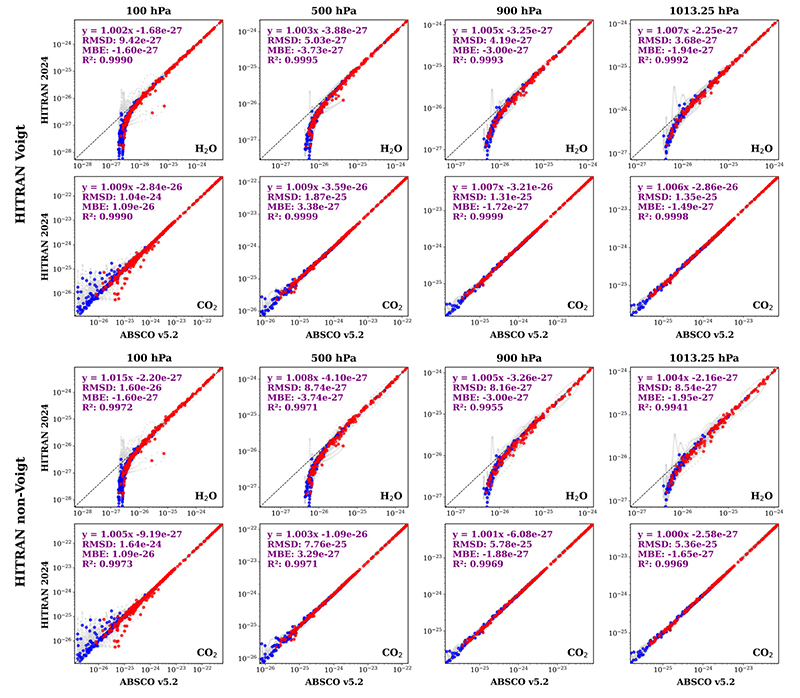
Comparison of absorption cross-sections of H2O and CO2 from HITRAN 2024 and ABSCO v5.2 data in the WCO2 band under different altitude conditions (pressures of 100, 500, 1013.25 hPa; temperatures of 216, 250, 196 K; and H2O VMRs of 1%). Red and blue markers indicate the peaks and valleys of the absorption lines, respectively.
앞서 기술한 바와 같이, HITRAN 데이터베이스를 사용한 LBL 선형 모델은 선 중심과 가장자리를 구분하여 흡수 프로파일이 계산된다. 이러한 구분은 압력에 의한 선폭 확장의 영향이 크기 때문에, 정확한 흡수 선 형상을 산출하는 데 핵심적인 역할을 한다(Schreier, 2018; Ngo et al., 2013). 높은 분광 해상도에서의 흡수 단면적은 복잡한 이론적인 현상을 설명하지만, 일반적인 위성 관측은 데이터베이스보다 낮은 분광 해상도로 이루어진다(Frankenberg et al., 2015). 그림 5는 분자 충돌이 빈번하게 발생하는 SCO2 대역의 좁은 분광 영역(2055~2065 nm) 내에서 OCO-2 슬릿 함수와 컨볼루션된 HITRAN 및 ABSCO 흡수선을 비교한다. 두 데이터베이스 간의 일치도는 컨볼루션 전보다 개선되었지만, 분광 잔차의 크기는 여전히 주변 압력과 온도에 크게 영향을 받는다. 예를 들어, 평균 절대 백분율 오차(Symmetric Mean Absolute Percentage Error, SMAPE)는 지표면 조건(1013.25 hPa, 296 K)에서 상층 대기 조건(100 hPa, 216 K)으로 3.1%에서 7.9%로 증가한다. 또한, 속도 의존, 딕 좁아짐, 압력 유도 이동을 포함한 복잡한 미시적 현상으로 인해 명확한 피크 간 불일치가 발생한다(Ngo et al., 2013). 각 피크는 두 데이터 간에 약간씩 이동하여 고정밀 위성 CO2 산출에 무시할 수 없는 오차를 유발할 수 있다(Thompson et al., 2012).
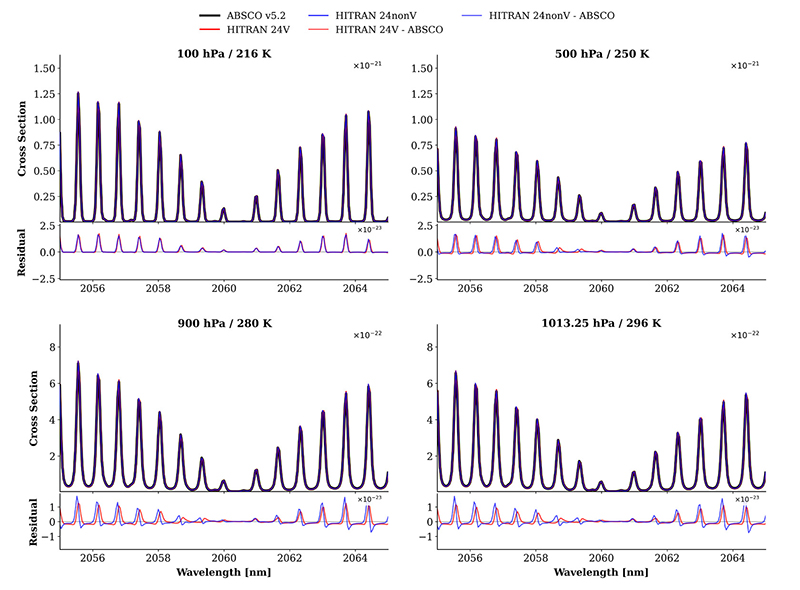
Absorption cross section of CO2 from ABSCO and HITRAN databases convolved with the OCO-2 spectrometers and residuals of the densely populated SCO2 band region (2055~2065 nm) across various pressures (100 to 1013.25 hPa), temperatures (216 to 296 K) under the H2O VMR of 1% condition.
한편, 그림 6은 수증기 연속 흡수(H2O Continuum)가 지배적인 대역에서 H2O 분자의 대기 층별 민감도를 보여준다. 그림 6에서 보여주는 2050~2060 nm 영역은 수증기 연속 흡수가 급격하게 나타나지 않고 천천히 나타나며(Mlawer et al., 2012), 이로 인해 연속 흡수가 포함된 ABSCO 데이터와 라인별 모델만을 고려한 HITRAN 계산 결과 사이에 일정한 오프셋이 발생한다. 이러한 오프셋의 강도는 고온 고압 환경인 하층 대기로 갈수록 더욱 뚜렷해지는데, 이는 수증기 자가 연속 흡수가 수증기 농도에 대한 이차 의존성이라는 비선형적인 물리적 특성에 기인한다.
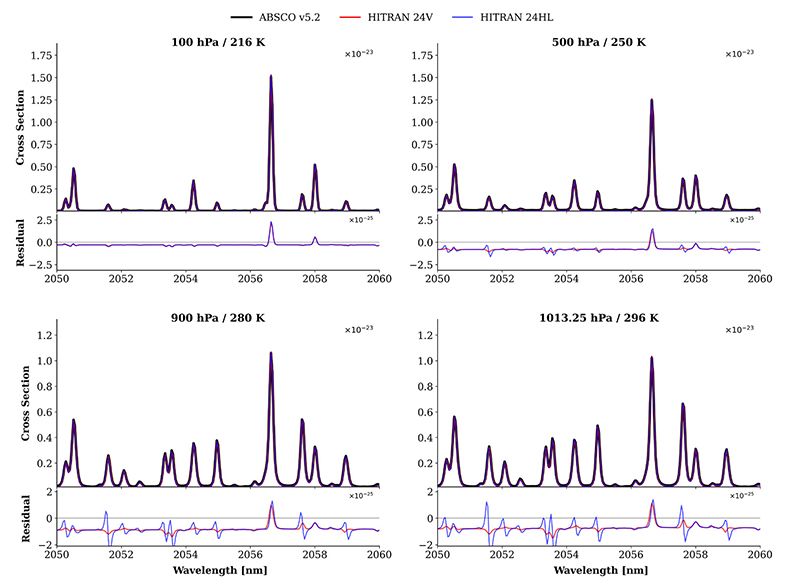
Comparison of H2O absorption cross-sections and their residuals in the 2050~2060 nm region. The upper panels display the spectral morphology under four atmospheric pressure and temperature conditions (100 to 1013.25 hPa). Calculations based on the HITRAN 24V (Voigt) and HITRAN 24nonV (non-Voigt) models are compared against the ABSCO v5.2 reference. The lower panels show the residuals, highlighting the systematic baseline offset in Line-By-Line (LBL) calculations due to the exclusion of the water vapor continuum.
분석 결과, 정교한 24nonV 모델을 적용하더라도 베이스라인 오프셋이 유지된다는 점은 선형 모델의 최적화와 연속 흡수 보정이 서로 독립적인 물리적 메커니즘임을 입증한다. 특히 연속 흡수 성분을 간과할 경우, 수증기 밀도가 높은 하층 대기의 근적외선 가열률을 과소평가해 복사 에너지 계산의 불확실성을 가중시킬 수 있다. 결과적으로, OCO-2나 GOSAT 등 고정밀 온실가스 관측 임무의 정확한 해석을 위해서는 개별 라인의 계산을 넘어 MT-CKD와 같은 검증된 연속 흡수 모델을 통합적으로 적용함으로써 하층 대기 복사 전달의 정밀도를 확보해야 한다.
4. 결 론
정립된 이론적 원리에 기반하여, 근적외선 스펙트럼 영역에서 WCO2 및 SCO2 대역을 중심으로 업데이트된 HITRAN 데이터베이스와 ABSCO v5.2 데이터 간의 교차 평가를 수행했다. 이러한 데이터베이스 사이의 스펙트럼 편차를 심층적으로 분석하기 위해, 선형 및 로그 스케일에서의 단면적 비교와 잔차 분석을 바탕으로 상대적인 구조적 차이를 살펴보았다. 과거 업데이트된 HITRAN 데이터 및 최근 버전의 HITRAN 데이터를 분석한 결과, HITRAN2016 및 HITRAN2024 기반 흡수 단면적 모두 ABSCO v5.2 표와 높은 일치도를 보였다. 그러나 H2O 스펙트럼의 경우, HITRAN 기반 모델이 ABSCO 기반 모델보다 낮은 기저선을 나타냈는데, 이는 MT-CKD 모델이 포함된 수증기 연속 흡수와 경험적 보정 인자의 유무 때문인 것으로 판단된다. 특히 2050~2060 nm 영역에서 나타나는 오프셋은 수증기 자가 연속 흡수의 이차 의존성에 기인하며, 이는 고농도 수증기 환경인 하층 대기 복사 전달에서 반드시 고려되어야 할 요소임을 확인하였다.
세부적인 스펙트럼 차이를 분석하고 평가하기 위해, 본 연구에서는 온도 및 압력과 같은 다양한 고도 조건에 대한 민감도를 평가했다. 지표면 조건에서 ABSCO 테이블과 HITRAN2024는 높은 일관성을 보였으며, 특히 H2O 스펙트럼의 경우, Voigt 모델이 non-Voigt 모델보다 ABSCO와의 수치적 차이가 더 작은 것으로 나타났다. 그러나 고도가 높아짐에 따라 분자 간의 충돌에서 도플러 확장으로 지배적인 물리 현상이 바뀌는 과정에서, 두 데이터베이스 간 SMAPE가 3.1%에서 7.9%로 증가하는 등 상층 대기의 불일치가 심화됨을 확인하였다. 또한, OCO-2 슬릿 함수와의 컨볼루션 이후 Voigt 모델에서 미세한 피크 이동 및 non-Voigt와 Voigt 모델에서의 잔차가 잔존하며, 이는 실제 위성 관측 데이터를 통한 산출에 있어 편향을 유발할 수 있는 잠재적 오차 원인임을 시사한다. 따라서 각 기체 흡수 데이터베이스의 정확도를 이해하고, 연속 흡수 모델과 개별 라인 파라미터를 통합적으로 최적화하는 것은 1% 미만의 정확도가 요구되는 위성 기반 온실가스 산출 알고리즘 개발에 있어 필수적이다.
Acknowledgments
본 연구를 위해 HITRAN 데이터베이스(hitran.org)를 제공해 준 HITRAN 팀에 감사의 마음을 전합니다. 또한, 본 연구에 활용된 ABSCO 테이블을 제공해 준 NASA 및 ACOS/OCO-2 프로젝트 팀에도 깊은 감사를 표합니다. 이 논문은 2023년도 정부(교육부)의 재원으로 한국연구재단의 G-램프(LAMP) 사업 지원을 받아 수행된 연구입니다(No. RS-2023-00301702).
References
-
Boone, C.D., Walker, K.A., Bernath, P.F. (2007) Speed-dependent Voigt profile for water vapor in infrared remote sensing applications, Journal of Quantitative Spectroscopy and Radiative Transfer, 105(3), 525-532.
[https://doi.org/10.1016/j.jqsrt.2006.11.015]

-
Crisp, D., Atlas, R.M., Breon, F.-M., Brown, L.R., Burrows, J.P., Ciais, P., Connor, B.J., Doney, S.C., Fung, I.Y., Jacob, D.J., Miller, C.E., O’Brien, D., Pawson, S., Randerson, J.T., Rayner, P., Salawitch, R.J., Sander, S.P., Sen, B., Stephens, G.L., Tans, P.P., Toon, G.C., Wennberg, P.O., Wofsy, S.C., Yung, Y.L., Kuang, Z., Chudasama, B., Sprague, G., Weiss, B., Pollock, R., Kenyon, D., Schroll, S. (2004) The Orbiting Carbon Observatory (OCO) mission, Advances in Space Research, 34(4), 700-709.
[https://doi.org/10.1016/j.asr.2003.08.062]
-
Crisp, D., Fisher, B.M., O’Dell, C., Frankenberg, C., Basilio, R., Bösch, H., Brown, L.R., Castano, R., Connor, B., Deutscher, N.M., Eldering, A., Griffith, D., Gunson, M., Kuze, A., Mandrake, L., McDuffie, J., Messerschmidt, J., Miller, C.E., Morino, I., Natraj, V., Notholt, J., O’Brien, D.M., Oyafuso, F., Polonsky, I., Robinson, J., Salawitch, R., Sherlock, V., Smyth, M., Suto, H., Taylor, T.E., Thompson, D.R., Wennberg, P.O., Wunch, D., Yung, Y.L. (2012) The ACOS CO2 retrieval algorithm - part II: global XCO2 data characterization, Atmospheric Measurement Techniques, 5(4), 687-707.
[https://doi.org/10.5194/amt-5-687-2012]
-
Crisp, D., Pollock, H.R., Rosenberg, R., Chapsky, L., Lee, R.A.M., Oyafuso, F.A., Frankenberg, C., O’Dell, C.W., Bruegge, C.J., Doran, G.B., Eldering, A., Fisher, B.M., Fu, D., Gunson, M.R., Mandrake, L., Osterman, G.B., Schwandner, F.M., Sun, K., Taylor, T.E., Wennberg, P.O., Wunch, D. (2017) The on-orbit performance of the Orbiting Carbon Observatory-2 (OCO-2) instrument and its radiometrically calibrated products, Atmospheric Measurement Techniques, 10(1), 59-81.
[https://doi.org/10.5194/amt-10-59-2017]
-
Eldering, A., Taylor, T.E., O’Dell, C.W., Pavlick, R. (2019) The OCO-3 mission: measurement objectives and expected performance based on 1 year of simulated data, Atmospheric Measurement Techniques, 12(4), 2341-2370.
[https://doi.org/10.5194/amt-12-2341-2019]
-
Eldering, A., Wennberg, P.O., Crisp, D., Schimel, D.S., Gunson, M.R., Chatterjee, A., Liu, J., Schwandner, F.M., Sun, Y., O’Dell, C.W., Frankenberg, C., Taylor, T., Fisher, B., Osterman, G.B., Wunch, D., Hakkarainen, J., Tamminen, J., Weir, B. (2017) The Orbiting Carbon Observatory-2 early science investigations of regional carbon dioxide fluxes, Science, 358(6360), eaam5745.
[https://doi.org/10.1126/science.aam5745]
-
Frankenberg, C., Pollock, R., Lee, R.A.M., Rosenberg, R., Blavier, J.-F., Crisp, D., O’Dell, C.W., Osterman, G.B., Roehl, C., Wennberg, P.O., Wunch, D. (2015) The Orbiting Carbon Observatory (OCO-2): spectrometer performance evaluation using pre-launch direct sun measurements, Atmospheric Measurement Techniques, 8(1), 301-313.
[https://doi.org/10.5194/amt-8-301-2015]
-
Gordon, I.E., Rothman, L.S., Hargreaves, R.J., Gomez, F.M., Bertin, T., Hill, C., Kochanov, R.V., Tan, Y., Wcisło, P., Makhnev, V.Y., Bernath, P.F., Birk, M., Boudon, V., Campargue, A., Coustenis, A., Drouin, B.J., Gamache, R.R., Hodges, J.T., Jacquemart, D., Mlawer, E.J., Nikitin, A.V., Perevalov, V.I., Rotger, M., Robert, S., Tennyson, J., Toon, G.C., Tran, H., Tyuterev, V.G., Adkins, E.M., Barbe, A., Bailey, D.M., Bielska, K., Bizzocchi, L., Blake, T.A., Bowesman, C.A., Cacciani, P., Čermák, P., Császár, A.G., Denis, L., Egbert, S.C., Egorov, O., Ermilov, A.Y., Fleisher, A.J., Fleurbaey, H., Foltynowicz, A., Furtenbacher, T., Germann, M., Guest, E.R., Harrison, J.J., Hartmann, J.-M., Hjältén, A., Hu, S.-M., Huang, X., Johnson, T.J., Jóźwiak, H., Kassi, S., Khan, M.V., Kwabia-Tchana, F., Lee, T.J., Lisak, D., Liu, A.-W., Lyulin, O.M., Malarich, N.A., Manceron, L., Marinina, A.A., Massie, S.T., Mascio, J., Medvedev, E.S., Meshkov, V.V., Mellau, G.C., Melosso, M., Mikhailenko, S.N., Mondelain, D., Müller, H.S.P., O’Donnell, M., Owens, A., Perrin, A., Polyansky, O.L., Raston, P.L., Reed, Z.D., Rey, M., Richard, C., Rieker, G.B., Röske, C., Sharpe, S.W., Starikova, E., Stolarczyk, N., Stolyarov, A.V., Sung, K., Tamassia, F., Terragni, J., Ushakov, V.G., Vasilchenko, S., Vispoel, B., Vodopyanov, K.L., Wagner, G., Wójtewicz, S., Yurchenko, S.N., Zobov, N.F. (2026) The HITRAN2024 molecular spectroscopic database, Journal of Quantitative Spectroscopy and Radiative Transfer, 353, 109807.
[https://doi.org/10.1016/j.jqsrt.2026.109807]
-
Gordon, I.E., Rothman, L.S., Hargreaves, R.J., Hashemi, R., Karlovets, E.V., Skinner, F.M., Conway, E.K., Hill, C., Kochanov, R.V., Tan, Y., Wcisło, P., Finenko, A.A., Nelson, K., Bernath, P.F., Birk, M., Boudon, V., Campargue, A., Chance, K.V., Coustenis, A., Drouin, B.J., Flaud, J.-M., Gamache, R.R., Hodges, J.T., Jacquemart, D., Mlawer, E.J., Nikitin, A.V., Perevalov, V.I., Rotger, M., Tennyson, J., Toon, G.C., Tran, H., Tyuterev, V.G., Adkins, E.M., Baker, A., Barbe, A., Canè, E., Császár, A.G., Dudaryonok, A., Egorov, O., Fleisher, A.J., Fleurbaey, H., Foltynowicz, A., Furtenbacher, T., Harrison, J.J., Hartmann, J.-M., Horneman, V.-M., Huang, X., Karman, T., Karns, J., Kassi, S., Kleiner, I., Kofman, V., Kwabia-Tchana, F., Lavrentieva, N.N., Lee, T.J., Long, D.A., Lukashevskaya, A.A., Lyulin, O.M., Makhnev, V.Y., Matt, W., Massie, S.T., Melosso, M., Mikhailenko, S.N., Mondelain, D., Müller, H.S.P., Naumenko, O.V., Perrin, A., Polyansky, O.L., Raddaoui, E., Raston, P.L., Reed, Z.D., Rey, M., Richard, C., Tóbiás, R., Sadiek, I., Schwenke, D.W., Starikova, E., Sung, K., Tamassia, F., Tashkun, S.A., Vander Auwera, J., Vasilenko, I.A., Vigasin, A.A., Villanueva, G.L., Vispoel, B., Wagner, G., Yachmenev, A., Yurchenko, S.N. (2022) The HITRAN2020 molecular spectroscopic database, Journal of Quantitative Spectroscopy and Radiative Transfer, 277, 107949.
[https://doi.org/10.1016/j.jqsrt.2021.107949]
-
Gordon, I.E., Rothman, L.S., Hill, C., Kochanov, R.V., Tan, Y., Bernath, P.F., Birk, M., Boudon, V., Campargue, A., Chance, K.V., Drouin, B.J., Flaud, J.-M., Gamache, R.R., Hodges, J.T., Jacquemart, D., Perevalov, V.I., Perrin, A., Shine, K.P., Smith, M.A.H., Tennyson, J., Toon, G.C., Tran, H., Tyuterev, V.G., Barbe, A., Császár, A.G., Devi, V.M., Furtenbacher, T., Harrison, J.J., Hartmann, J.-M., Jolly, A., Johnson, T.J., Karman, T., Kleiner, I., Kyuberis, A.A., Loos, J., Lyulin, O.M., Massie, S.T., Mikhailenko, S.N., Moazzen-Ahmadi, N., Müller, H.S.P., Naumenko, O.V., Nikitin, A.V., Polyansky, O.L., Rey, M., Rotger, M., Sharpe, S.W., Sung, K., Starikova, E., Tashkun, S.A., Vander Auwera, J., Wagner, G., Wilzewski, J., Wcisło, P., Yu, S., Zak, E.J. (2017) The HITRAN2016 molecular spectroscopic database, Journal of Quantitative Spectroscopy and Radiative Transfer, 203, 3-69.
[https://doi.org/10.1016/j.jqsrt.2017.06.038]
-
Hamazaki, T., Kaneko, Y., Kuze, A., Kondo, K. (2005) Fourier transform spectrometer for Greenhouse Gases Observing Satellite (GOSAT), Proceedings of SPIE, 5659, 73-80.
[https://doi.org/10.1117/12.581198]
-
Hartmann, J.-M., Tran, H., Toon, G.C. (2009) Influence of line mixing on the retrievals of atmospheric CO2 from spectra in the 1.6 and 2.1 μm regions, Atmospheric Chemistry and Physics, 9(19), 7303-7312.
[https://doi.org/10.5194/acp-9-7303-2009]
-
Hobbs, J.M., Drouin, B.J., Oyafuso, F., Payne, V.H., Gunson, M.R., McDuffie, J., Mlawer, E.J. (2020) Spectroscopic uncertainty impacts on OCO-2/3 retrievals of XCO2, Journal of Quantitative Spectroscopy and Radiative Transfer, 257, 107360.
[https://doi.org/10.1016/j.jqsrt.2020.107360]
-
HumlÍček, J. (1979) An efficient method for evaluation of the complex probability function: the Voigt function and its derivatives, Journal of Quantitative Spectroscopy and Radiative Transfer, 21(4), 309-313.
[https://doi.org/10.1016/0022-4073(79)90062-1]
-
Imasu, R., Matsunaga, T., Nakajima, M., Yoshida, Y., Shiomi, K., Morino, I., Someya, Y., Ohyama, H., Nishizawa, T., Hiraki, K., Fofonova, V., Miyamoto, A., Hashimoto, M., Kikuchi, N., Suto, H., Kataoka, F., Knuteson, R.O., Kuze, A., Shi, C. (2023) Greenhouse gases Observing SATellite 2 (GOSAT-2): mission overview, Progress in Earth and Planetary Science, 10(1), 33.
[https://doi.org/10.1186/s40645-023-00562-2]
-
Lamouroux, J., Régalia, L., Thomas, X., Vander Auwera, J., Gamache, R.R., Hartmann, J.M. (2015) CO2 line-mixing database and software update and its tests in the 2.1 μm and 4.3 μm regions, Journal of Quantitative Spectroscopy and Radiative Transfer, 151, 88-96.
[https://doi.org/10.1016/j.jqsrt.2014.09.017]
- McClatchey, R.A., Burch, D.E., Rothman, L.S., Benedict, W.S., Calfee, R.F., Garing, J.S., Clough, S.A., Fox, K. (1973) AFCRL atmospheric absorption line parameters compilation, Environmental Research Papers, 434, 1-86. https://lweb.cfa.harvard.edu/HITRAN/Download/AFCRL73.pdf
-
Mendonca, J., Strong, K., Wunch, D., Toon, G.C., Long, D.A., Hodges, J.T., Sironneau, V.T., Franklin, J.E. (2019) Using a speed-dependent Voigt line shape to retrieve O2 from Total Carbon Column Observing Network solar spectra to improve measurements of XCO2, Atmospheric Measurement Techniques, 12(1), 35-50.
[https://doi.org/10.5194/amt-12-35-2019]
-
Miller, C.E., Brown, L.R., Toth, R.A., Benner, D.C., Devi, V.M. (2005) Spectroscopic challenges for high accuracy retrievals of atmospheric CO2 and the Orbiting Carbon Observatory (OCO) experiment, Comptes Rendus Physique, 6(8), 876-887.
[https://doi.org/10.1016/j.crhy.2005.09.005]
-
Mlawer, E.J., Payne, V.H., Moncet, J.-L., Delamere, J.S., Alvarado, M.J., Tobin, D.C. (2012) Development and recent evaluation of the MT_CKD model of continuum absorption, Philosophical Transactions of the Royal Society A, 370(1968), 2520-2556.
[https://doi.org/10.1098/rsta.2011.0295]
-
Ngo, N.H., Lisak, D., Tran, H., Hartmann, J.M. (2013) An isolated line-shape model to go beyond the Voigt profile in spectroscopic databases and radiative transfer codes, Journal of Quantitative Spectroscopy and Radiative Transfer, 129, 89-100.
[https://doi.org/10.1016/j.jqsrt.2013.05.034]
-
O’Dell, C.W., Eldering, A., Wennberg, P.O., Crisp, D., Gunson, M.R., Fisher, B., Frankenberg, C., Kiel, M., Lindqvist, H., Mandrake, L., Merrelli, A., Natraj, V., Nelson, R.R., Osterman, G.B., Payne, V.H., Taylor, T.E., Wunch, D., Drouin, B.J., Oyafuso, F., Chang, A., McDuffie, J., Smyth, M., Baker, D.F., Basu, S., Chevallier, F., Crowell, S.M.R., Feng, L., Palmer, P.I., Dubey, M., García, O.E., Griffith, D.W.T., Hase, F., Iraci, L.T., Kivi, R., Morino, I., Notholt, J., Ohyama, H., Petri, C., Roehl, C.M., Sha, M.K., Strong, K., Sussmann, R., Te, Y., Uchino, O., Velazco, V.A. (2018) Improved retrievals of carbon dioxide from Orbiting Carbon Observatory-2 with the version 8 ACOS algorithm, Atmospheric Measurement Techniques, 11(12), 6539-6576.
[https://doi.org/10.5194/amt-11-6539-2018]
-
Payne, V.H., Drouin, B.J., Oyafuso, F., Kuai, L., Fisher, B.M., Sung, K., Nemchick, D., Crawford, T.J., Smyth, M., Crisp, D., Adkins, E., Hodges, J.T., Long, D.A., Mlawer, E.J., Merrelli, A., Lunny, E., O’Dell, C.W. (2020) Absorption coefficient(ABSCO) tables for the Orbiting Carbon Observatories: Version 5.1, Journal of Quantitative Spectroscopy and Radiative Transfer, 255, 107217.
[https://doi.org/10.1016/j.jqsrt.2020.107217]
- Payne, V.H., Oyafuso, F. (2022) ABSCO User Guide (Revision Date: February 25, 2022), Jet Propulsion Laboratory, California Institute of Technology. https://docserver.gesdisc.eosdis.nasa.gov/public/project/OCO/ABSCO_v5p2_User_Guide.pdf
-
Rosenkranz, P.W. (1975) Shape of the 5 mm oxygen band in the atmosphere, IEEE Transactions on Antennas and Propagation, 23(4), 498-506.
[https://doi.org/10.1109/TAP.1975.1141119]
-
Schreier, F. (2018) The Voigt and complex error function: HumlÍček’s rational approximation generalized, Monthly Notices of the Royal Astronomical Society, 479(3), 3068-3075.
[https://doi.org/10.1093/mnras/sty1680]
-
Schreier, F., Hochstaffl, P. (2021) Computational aspects of speed-dependent Voigt and Rautian profiles, Journal of Quantitative Spectroscopy and Radiative Transfer, 258, 107385.
[https://doi.org/10.1016/j.jqsrt.2020.107385]
-
Tennyson, J., Bernath, P.F., Campargue, A., Császár, A.G., Daumont, L., Gamache, R.R., Hodges, J.T., Lisak, D., Naumenko, O.V., Rothman, L.S., Tran, H., Zobov, N.F., Buldyreva, J., Boone, C.D., De Vizia, M.D., Gianfrani, L., Hartmann, J.M., McPheat, R., Weidmann, D., Murray, J., Ngo, N.H., Polyansky, O.L. (2014) Recommended isolated-line profile for representing high-resolution spectroscopic transitions(IUPAC Technical Report), Pure and Applied Chemistry, 86(12), 1931-1943.
[https://doi.org/10.1515/pac-2014-0208]
-
Thompson, D.R., Benner, D.C., Brown, L.R., Crisp, D., Devi, V.M., Jiang, Y., Natraj, V., Oyafuso, F., Sung, K., Wunch, D., Castaño, R., Miller, C.E. (2012) Atmospheric validation of high accuracy CO2 absorption coefficients for the OCO-2 mission, Journal of Quantitative Spectroscopy and Radiative Transfer, 113(17), 2265-2276.
[https://doi.org/10.1016/j.jqsrt.2012.05.021]
-
Tran, H., Ngo, N.H., Hartmann, J.-M. (2013) Efficient computation of some speed-dependent isolated line profiles, Journal of Quantitative Spectroscopy and Radiative Transfer, 129, 199-203.
[https://doi.org/10.1016/j.jqsrt.2013.06.015]
-
Wcisło, P., Gordon, I.E., Tran, H., Tan, Y., Hu, S.M., Campargue, A., Kassi, S., Romanini, D., Hill, C., Kochanov, R.V., Rothman, L.S. (2016) The implementation of non-Voigt line profiles in the HITRAN database: H2 case study, Journal of Quantitative Spectroscopy and Radiative Transfer, 177, 75-91.
[https://doi.org/10.1016/j.jqsrt.2016.01.024]
-
Wcisło, P., Stolarczyk, N., Słowiński, M., Jóźwiak, H., Lisak, D., Ciuryło, R., Cygan, A., Schreier, F., Boone, C.D., Castrillo, A., Gianfrani, L., Tan, Y., Hu, S.M., Adkins, E.M., Hodges, J.T., Tran, H., Ngo, H.N., Hartmann, J.M., Beguier, S., Campargue, A., Hargreaves, R.J., Rothman, L.S., Gordon, I.E. (2025) New beyond-Voigt line-shape profile recommended for the HITRAN database, Journal of Quantitative Spectroscopy and Radiative Transfer, 347, 109596.
[https://doi.org/10.1016/j.jqsrt.2025.109596]
박세현(부경대학교 지구환경시스템과학부 공간정보시스템공학과 석사과정학생) (sehyeon.park726@gmail.com)
정욱교(부경대학교 지구환경시스템과학부 공간정보시스템공학과 조교수) (ukkyo.jeong@pknu.ac.kr)
최회준(부경대학교 지구환경시스템과학부 공간정보시스템공학과 석사과정학생) (heojun_choi@pukyong.ac.kr)
박호성(부경대학교 지구환경시스템과학부 공간정보시스템공학과 석사과정학생) (hosung_park@pukyong.ac.kr)
신민규(부경대학교 지구환경시스템과학부 공간정보시스템공학과 학부생) (mingyu911@naver.com)