Pollutant Dispersion from a Structural Fire Accident and its Effect on the Local Environment using a CFD Model
Abstract
The increasing occurrence of urban fires and their uncontrollable nature significantly impact health, the environment, and infrastructure. Individual large-scale fires have the potential to emerge as significant sources, given their notable contribution to the total atmospheric emissions within a city. In this study, the fire plume resulting from an accidental structural fire was simulated over an 8-hour particle emission period using a computational fluid dynamics (CFD) model. The emission parameters were estimated based on the dimensions of the burned area and the materials involved. Initial and boundary conditions were derived from data provided by a local forecasting model. Meteorological data and estimated emissions were validated against local observation stations. The CFD model employed in this study simulated the fire plume and pollutant dispersion hourly throughout the fire event, analyzing its effects on the local meteorological parameters in an area densely populated by buildings.
초록
도시 지역의 화재 발생 빈도 증가와 통제하기 어려운 화재의 특성은 건강, 환경과 지역 인프라에 상당한 영향을 미친다. 특히, 대규모 화재는 도시 지역의 대기 오염물질 배출량에 크게 기여하여 주요 배출원이 될 가능성이 있다. 본 연구에서는 전산 유체 역학 (computational Áuid dynamic, CFD) 모델을 이용하여 우발적 구조물 화재 (accidental structural Àre)로 인한 화재 기류를 수치 모의하였고, 화재로 인한 배출 시간은 실제 화재 발생 시간인 8시간으로 설정하였다. 배출 매개 변수는 화재가 발생한 면적과 화재 발생 시 생성되는 물질을 고려하여 추정하였다. 초기와 경계 기상 조건은 지역 수치예보모델 (local data assimilation and prediction system, LDAPS)을 사용하였다. CFD 모델의 기상장과 농도장 모의 성능을 검증하기 위해 수치 모의 대상 영역 내에 포함된 기상 관측소와 대기질 측정소에서 측정한 기상과 대기질 측정 자료와 비교하여 검증하였다. 본 연구에서는 CFD 모델을 이용하여 우발적 구조 화재가 발생했을 때 건물이 밀집한 지역에서 기상 매개 변수 (풍속과 풍향)이 화재 기류에 미치는 영향을 분석했다.
Keywords:
Air pollution, Fire plume, Air quality model, Structural urban fire, CFD modeling키워드:
대기오염, 화재 플룸, 대기질 모델, 우발적 구조 화재, CFD 모델링1. Introduction
In the last century, rapid urbanization worldwide has resulted in an increase in high-density building areas due to the shortage of land in highly populated cities (Sha and Qi, 2020). Although such building areas contribute to local development, they also pose significant disadvantages, including an increased risk of urban structural fires due to fire safety challenges. The incidence of building fires has escalated in recent years, and their uncontrollable nature has become one of the leading causes of anthropogenic disasters (AGCS, 2018). Each year, fires and explosions in urban areas account for the majority (59%) of business interruption claims worldwide (AGCS, 2018), resulting in approximately 401,000 deaths and millions of individuals sustaining lifetime injuries and disabilities (CTIF, 2022). Additionally, the economic losses are estimated to be between 1 to 2% of the global Gross Domestic Product (GDP) (McNamee et al., 2019; WHO, 2014), which corresponds to approximately USD 2 billion in 2023.
In South Korea, there is an average of 41,724 fires per year, with 12.2% occurring in Seoul, and an average of 329 deaths and 1,986 injured persons per year. The frequency of structural fires in South Korea is higher than in France (32.3%), the United States (35.3%), Russia (36.4%), and Japan (55.8%), comprising 64.5% of all reported fires (including vehicle, forest, and waste fires), and accounting for 82.2% of fire-related deaths and 82.6% of fire-related injuries (Rahman et al., 2023; CTIF, 2022).
Pollutants emitted during a fire can affect an entire community through various particles and toxic gases, depending on the material burned. In particular, the fine particles (PM, PM10, PM2.5) produced in fires pose significant threats to human health, causing short- and long-term effects such as respiratory difficulties, chronic illness, and even death (Manisalidis et al., 2020). As these particles can be transported both locally and over long distances from a fire event, atmospheric dispersion modeling is a crucial approach to evaluating the impacts of urban fires. This modeling simulates pollutant emission and quantifies the surface-level concentrations in urban settings, thereby aiding in air quality control and improvement. Historically, Gaussian models have dominated the application of pollutant dispersion in simplified urban settings. However, these models can be unsuitable for realistic urban situations due to their simplification of flow and failure to account for complex urban geometries and terrain (Lotrecchiano et al., 2020; Daly et al., 2012).
Computational fluid dynamics (CFD) models, which consider flow turbulence, velocities, and the effects of flow mixing in three-dimensional environments, have recently been employed in hazard analysis cases. However, specific CFD fire models, such as fire dynamic simulators (FDS) and FireFOAM, have primarily been implemented in semi-closed spaces such as street canyons and compartments (Palampigik et al., 2023; Li et al., 2021; Cui et al., 2020; Pesic et al., 2014). FDS is a popular CFD tool used to model the concentration, flow distribution, and fire development in urban environments. This model includes a thermally expandable multicomponent mixture of ideal gases and the low-speed motion of the gas driven by heat and buoyancy forces (Baggio et al., 2022; Gannouni and Ben Maad, 2017; Pesic et al., 2014). FireFOAM, a CFD model-based fire simulation tool within the OpenFOAM software suite, is utilized for the analysis of complex physical phenomena associated with fires. FireFOAM comprehensively addresses various aspects of fire dynamics, including combustion, radiation, heat transfer, and fluid flow, making it widely employed for predicting fire spread across diverse environments (Jahn et al., 2023, Shelke et al., 2020). These models are designed to capture the complex behavior of fire itself with detailed combustion processes, requiring extensive computational resources and time. Consequently, applying them to larger domains for extended period, such as neighborhoods and cities, necessitates the coupling of multiple models, leading to inconsistencies and higher computational costs (Baggio et al., 2022; Fiates and Vianna, 2016).
Therefore, implementing a computationally efficient and agile numerical model that can simulate the dispersion of fire pollutants in complex urban environments is a fundamental step toward understanding these fire accidents in an urban context. Providing policymakers with relevant evidence, such as that presented in this study, can guide them to prioritizing efforts to improve air quality in urban areas and in implementing effective mitigation and prevention strategies. This study aimed to simulate the dispersion of PM10 as a consequence of an actual structural fire accident over an 8-hour particle emission period using a CFD model. We analyzed the dispersion characteristics of the fire pollutants and the fire plume, along with their effects on the local environment by considering heat release and hourly variable wind conditions.
2. Methods
2. 1 Model description
The numerical model utilized in this study was the CFD model used by Mun et al. (2021) and developed by Kim and Baik (2010), which is based on unsteady Reynolds-averaged Navier-Stokes equations (RANS) and assumes three-dimensional, non-hydrostatic, and non-rotating flow. The finite volume method and semi-implicit method for a pressure-linked equation (SIMPLE) algorithm (Patankar, 1980) were employed to numerically solve the governing equation set on a staggered grid system (Kim et al., 2014). To accurately reflect the effects of the turbulent boundary layer, the wall boundary conditions recommended by Versteeg and Malalasekera (2007) were applied.
2. 2 Case study
An accidental fire occurred in the underground parking facility of a retail department store in Daejeon, South Korea, on September 26th, 2022, at 07:45 KST. The fire lasted approximately 8 hours, causing disruptions to nearby schools and commercial establishments and resulting in the tragic death of seven people. Although the fire was ignited by the heating exhaust of a vehicle near clothing storage units, the primary combustible material fueling the fire was rigid polyurethane foam (PUF), predominately present on the parking structure’s ceiling, which contributed to the rapid horizontal propagation of the fire (FPN, 2022). PUF is a widely used material in the construction industry, particularly for its application on rooftops or between walls to insulate buildings and improve energy efficiency. However, when PUF ignites, it emits particulate matter (PM, PM10, PM2.5), carbon monoxide (CO), carbon dioxide (CO2), nitrogen oxides (NOx), and extremely toxic gases such as hydrogen cyanide (HCN), hydrogen fluoride (HF), hydrogen chloride (HCl), and gaseous ammonia (NH3). These lethal gases are released into the atmosphere, causing severe damage to human health (McKenna and Hull, 2016; Bushfire CRC, 2011).
2. 3 Model validation
To accurately represent the topographical environment, geographic information system (GIS) data were collected for two different domains (Table 1). Domain 1 was 20 km in both the west-east and north-south directions and extended 1.2 km vertically. Due to the large size of the domain, the horizontal and vertical resolutions were set to 100 m and 10 m, respectively (Fig. 1a). Domain 2 was 4 km in both horizontal directions and 0.5 km in a vertical direction. The cell size was uniformly set to 10 m in all directions, with variable growth in the vertical direction above 150 m. The CFD model employed a Schmidt number of 0.2, a calculated settling velocity of pollutant particles of 0.0048 m s-1, and was numerically integrated for 3600 s at a 1 s interval for the 8 hours duration of the fire.
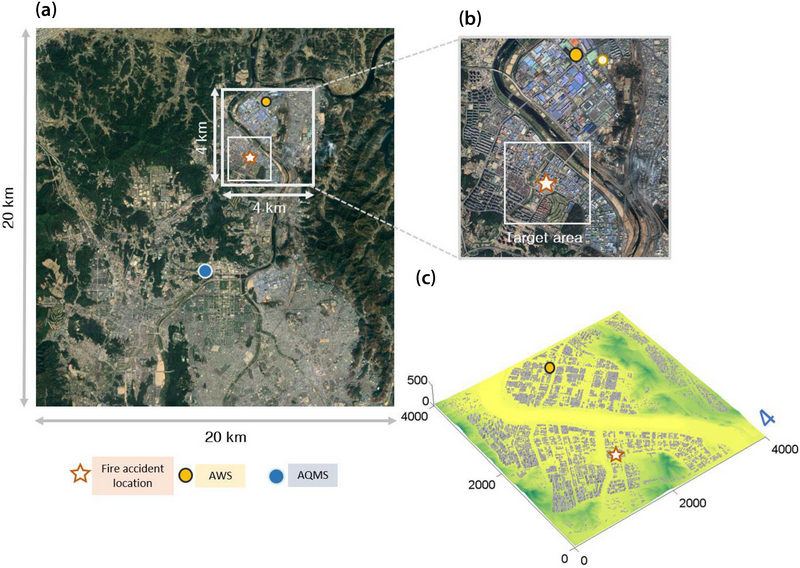
Satellite images for the domains (a) 1 and (2) with the fire accident location, an automated weather station (AWS), and an air quality monitoring station (AQMS) and (c) the three-dimensional configuration of topography and buildings in domain 2.
For the inlet boundary conditions, the local data assimilation and prediction system (LDAPS) from the Korea Meteorological Administration was utilized. LDAPS is a local forecast model with a spatial resolution of 1.5 km horizontally, providing boundary fields from the global model at 3-hour intervals, 8 times a day. To validate the data provided by LDAPS regarding wind speed, wind direction, and air temperature, measured data from the atmospheric weather monitoring station (AWS) located in a fire station in Munpyeong-dong (Fig. 1) were selected, as it was the closest AWS to the fire accident (approximately 2.5 km to the north-east). This proximity provided a better understanding of the wind conditions during the fire. The meteorological data were validated in both domains to accurately represent the actual conditions (Fig. 2).
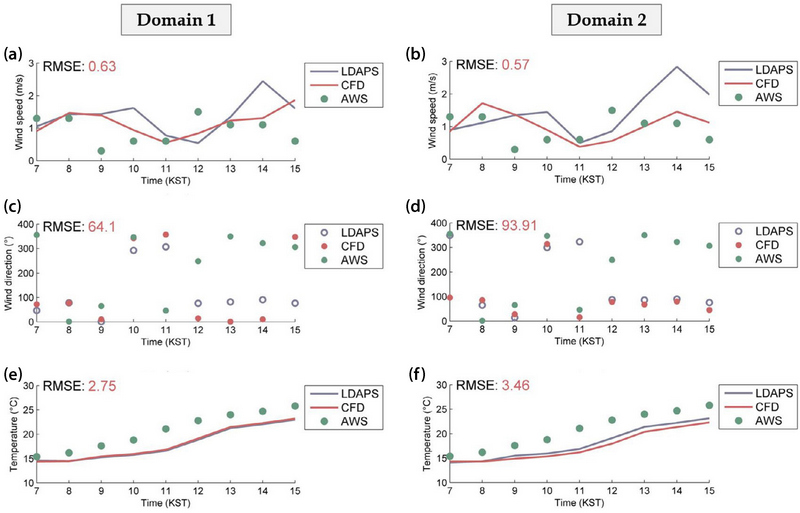
Time series of the 10 m wind speeds [(a) and (b)] and directions [(c) and (d)] and 2 m air temperatures [(e) and (f)] measured at AWS and predicted by the CFD model and LDAPS during the fire accident for domain 1 (left panel) and 2 (right panel).
Due to the occurrence of the fire in the subterranean parking facility, the propagation of the fire to the surface was limited by the openings such as the entrance, windows, and ventilation system. Therefore, the estimated heat release from these surface sources was assumed to be 600°C (Tang et al., 2002) and was constantly emitted throughout the 8-hour duration of the fire.
For the estimation of pollutant emissions during the fire, the emission release rate (ER) of pollutants, as suggested by the Minnesota Pollution Control Agency (2023), was calculated by multiplying the emission factor (EF) with the maximum capacity of the operation (C), which depends on the units of the emission factor. This is represented as follows:
The emission factor was calculated as mass units per number of accidents (fires) or units of burned material (PUF). EF1 was a PM10 emission factor specifically for burned PUF, while EF2 and EF3 were general PM emission factors for structural fires; therefore, both were considered as PM10 for practical calculations (Table 2). The concentration was estimated based on the amount of burned material. For this study, an estimation of 80 tons of burned PUF was considered, which was calculated based on the average thickness of rigid PUF sprayed in South Korean buildings according to legal requirements, as well as the burned area reported by an insulation construction company (FPN, 2022).
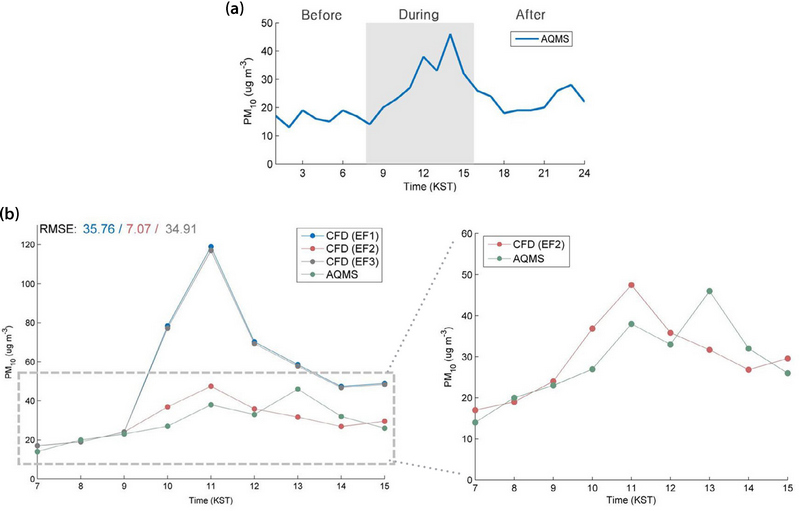
The three emission factors (Table 2) with their corresponding emission release rates were applied in the CFD model in Domain 1 and validated against the nearest air quality monitoring station (AQMS) along the plume direction, located Guseong-dong, situated 9 km away from the pollutant source (Fig. 1). EF1 and EF3 showed comparable levels of overestimation, whereas EF2 provided a closer approximation to measured values at the AQMS during the fire (Fig. 3). Consequently, EF2 was selected for the analysis of pollutant dispersion.
3. Results and Discussion
3. 1 Flow and temperature distributions
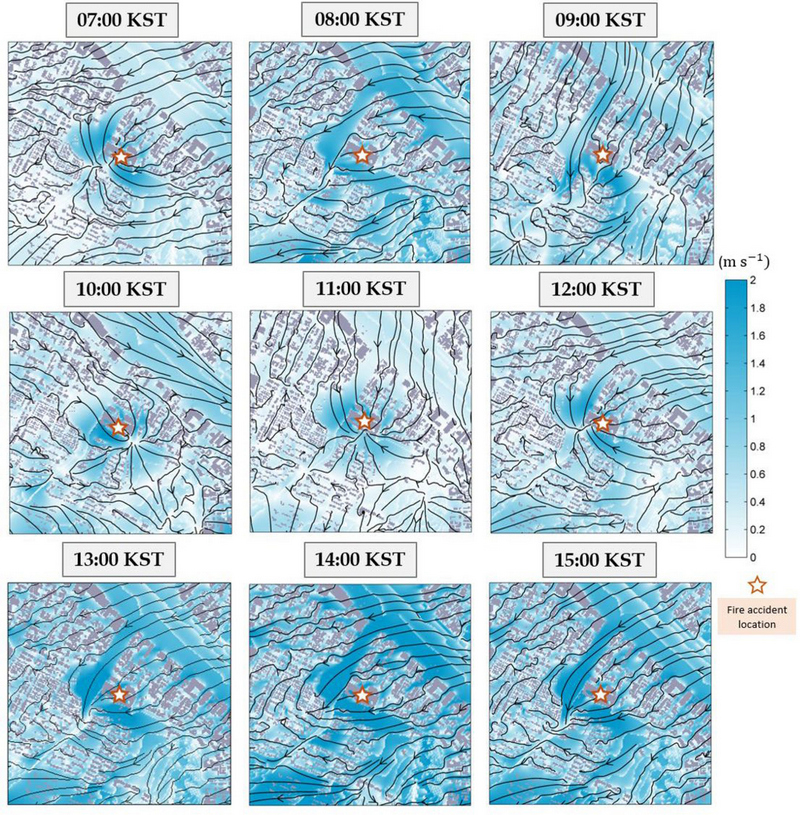
We analyzed the flow distributions affected by a local heat source from an accidental urban fire and their modifications in the local wind speed and direction surrounding the fire accident location. After validating the inlet boundary conditions (Section 2.3), the airflow in Domain 2 (Fig. 1c) was simulated during the 8-hour period when the fire was active. The streamlines of airflow in the target area (Fig. 1b) were observed both in the absence (Fig. 4) and presence (Fig. 5) of a heat source. When a heat source was not considered (Fig. 4), the wind speed remained relatively low in the target area. In particular, the apartments consisting of mid-rise and high-rise buildings located in the southwest of the target area created numerous street canyons, where extremely low wind or almost calm winds were present. Although the local wind speed was relatively low during the first 6 hours of the fire, when a heat source was considered (Fig. 5), a sudden change in wind direction and an increase in wind speed were observed in the area closest to the fire accident location. This centralized increment in wind speed slightly modified its fire accident location depending on the wind direction; however, it remained close to the structure where the fire occurred. The highest impact generated by the increment of wind speed during the fire was observed particularly at 08:00, 09:00, and 10:00 KST when the fire-induced direction was facing the buildings in the southwest of the target area.
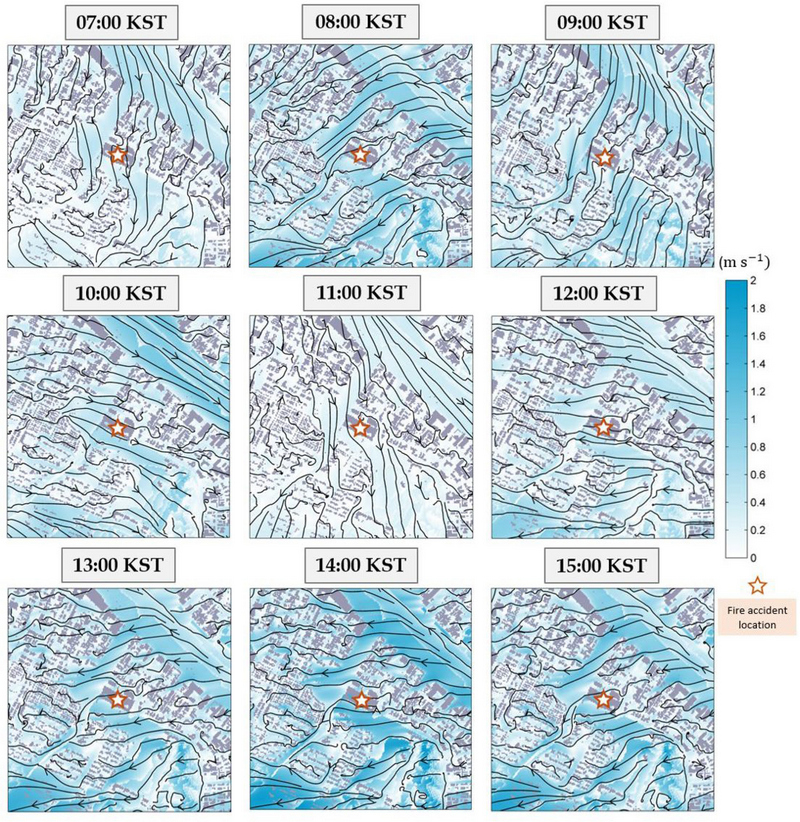
The streamlines and contours of wind speeds at the surface level (z=5 m) in the absence of a heat source.
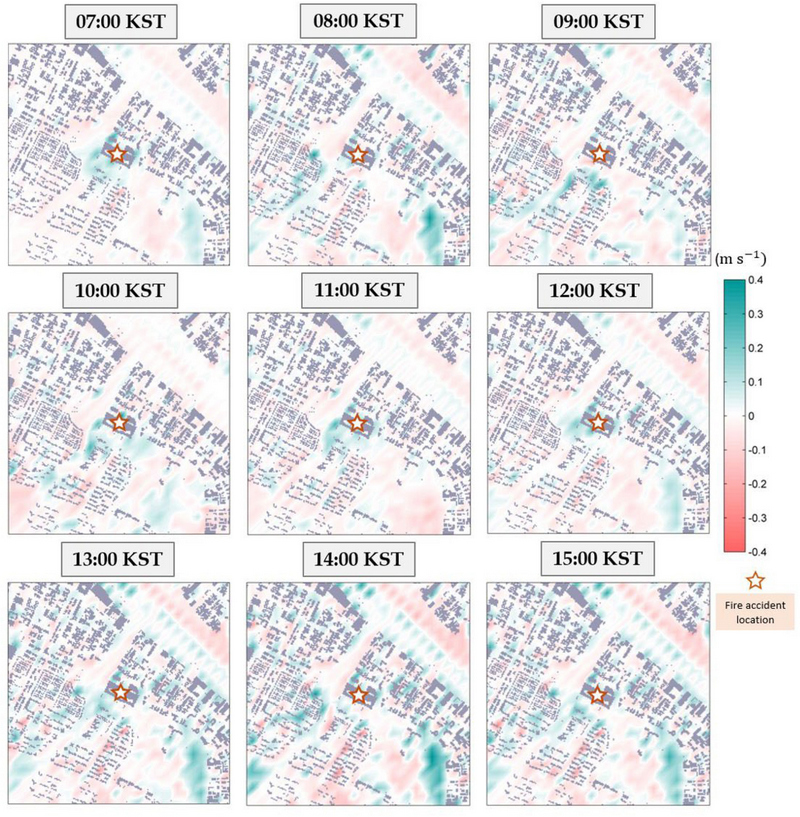
To further examine the effects of heat on the local airflows, we analyzed the distributions of the vertical wind velocities (w wind components) in the absence and presence of a heat source, respectively (Figs. 6 and 7). The upward and downward movements of the airflows were strengthened in the target area when a heat source was considered; however, in the absence of a heat source, the upward movement was rare around the fire structure. Even though most of the updraft was located near the fire structure, particularly from 09:00 to 11:00 KST and at 13:00 KST, the updraft moved slightly to the south and southwest facing the high-rise buildings.
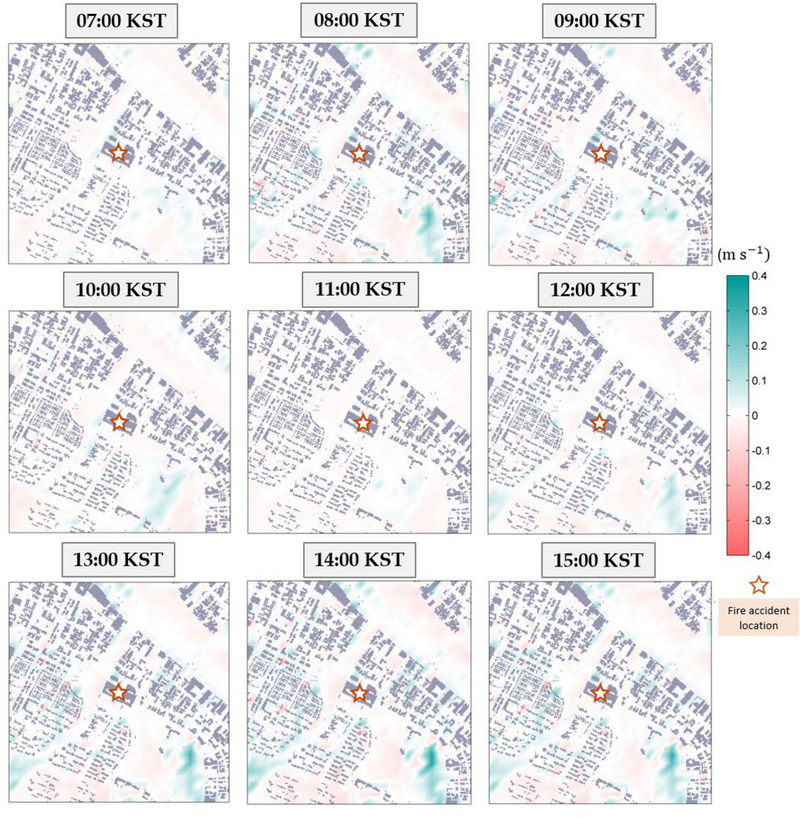
Contours of the vertical wind velocities at the surface level (z=5 m) in the absence of a heat source.
The effects of an urban fire on the wind flow adjacent to the fire accident location, such as the centralized increase of wind speed (Fig. 5) and the upward movement of air (Fig. 7), were closely related to the presence of a heat source. In more detail, the heat released from the fire raised the temperature of the air, causing it to move upward and creating a low-pressure zone near the fire. This low-pressure zone attracted air from the surrounding areas to replace the hot air that ascended. Due to the fire-induced convection phenomenon, the wind was confined near the fire, reducing the airflow circulation that would otherwise disperse the pollutants emitted by the fire.
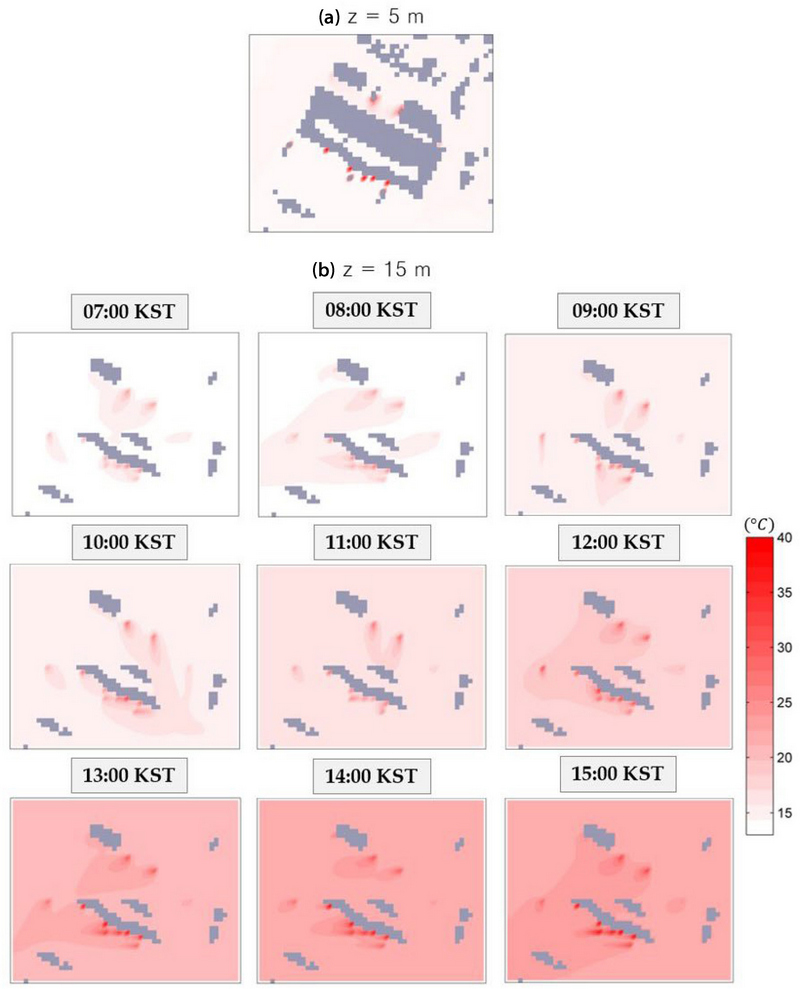
The presence of fire in an urban area not only affected the wind flow but also, the wind flow had a direct impact on the combustion and propagation of the flames and smoke. Thus, we examined the air temperature distributions at different heights during the fire. The fire plume at z=5 m (Fig. 8a) did not disperse much compared to that at z=15 m (Fig. 8b). At z=15 m, regardless of the background air temperature, the heat release and dispersion were influenced by varying wind conditions, which altered the angle of the fire plume. For the majority of the fire accident duration, the fire plume remained close to the structure, which was related to the fire induced convection of airflow mentioned in Section 3.1. However, significant dispersion of the fire plume was observed at 08:00, 13:00, and 15:00 KST, due to the relatively high wind speeds during those particular hours, and the ascending airflow zone shifting to the left side of the structure.
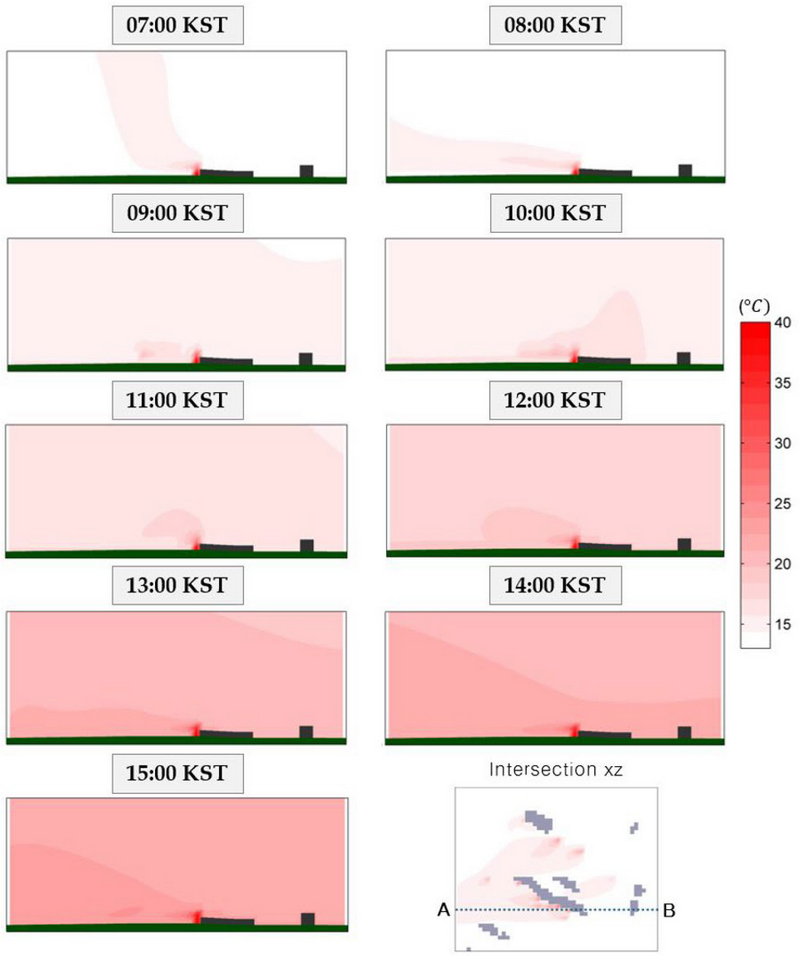
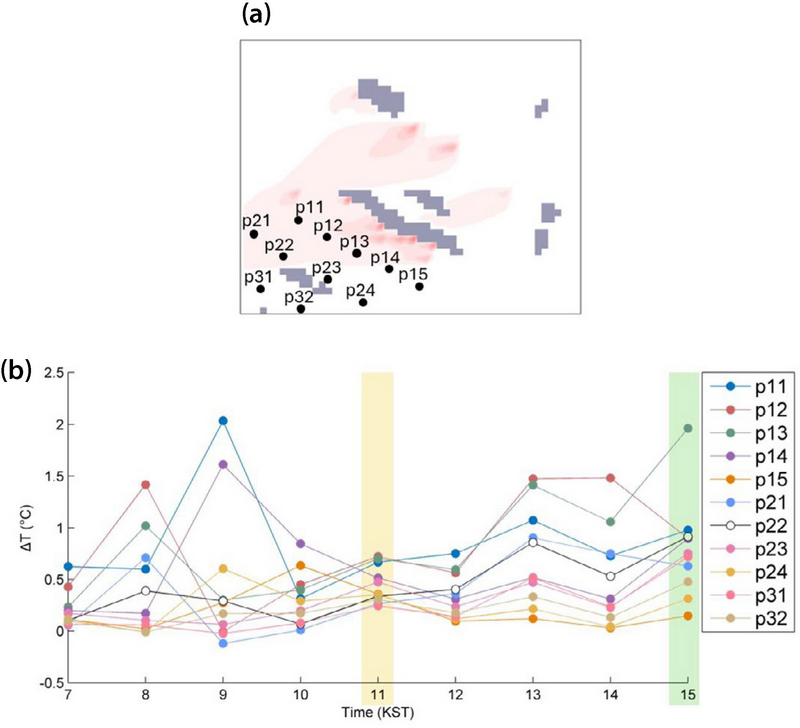
The vertical crosssection along shows the fire plume rising and dispersing into the surroundings (Fig. 9). At 07:00 KST, the fire plume ascended due to the positive buoyancy from the fire accident location, but the heat remained concentrated vertically and did not disperse well. Similar low dispersion behaviors were observed from 09:00 to 12:00 KST and at 14:00 KST, with the heat staying close to the fire accident location due to low wind speed, centralized convection (Figs. 5 and 7), and minimal air temperature changes near and far from the fire accident location (Fig. 10). Notably, Fig. 10 shows a significant air temperature change at p11 at 09:00 KST, unlike other times, due to reduced dispersion from low air temperature variation. This sudden increase was because p11 was near a heat source with direct airflow. Other points showed no significant air temperature difference, with the fire plume staying close to the fire accident location (Fig. 8). In contrast, a well-dispersed fire plume was observed at 08:00, 13:00, and 15:00 KST, where the fire plume extended horizontally, covering a wider area with its heat due to the strong horizontal airflow that confined the heat near the surface (Fig. 5) and displaced the rise of vertical wind slightly away from the building (Fig. 7). Simultaneously, during these hours, the emitted heat was well distributed into the surroundings, presenting a gradual decrease of air temperature as seen in points from the first line (p11 to p15) compared to the second line (p21 to p24), as well as farther points in the third line (p31 and p32) (Fig. 10).
3. 2 Pollutant dispersion
As the local environment altered the behavior of the fire, the fire also modified the dispersion of emitted pollutants, especially in an area congested by buildings. Fig. 11 shows the dispersion of PM10 during the fire accident in the absence of a heat source. The pollutant concentration was highly dependent on the wind flow, which varied hourly while the fire was active. However, a crucial factor in the pollutant dispersion was the presence of high-rise buildings. In particular, during the emission of the pollutants at 08:00, 09:00, and 15:00 KST, several street canyons formed by high-rise buildings created specific zones with relatively lower concentrations than their adjacent street canyons. This was attributable to the higher airflow (Fig. 5), especially when transported perpendicular to the street canyon, facilitating the exchange of air and a more efficient dilution of the pollutants to be transported away. Furthermore, the mentioned street canyons, although situated between high-rise buildings, had relatively wider spaces compared to the surrounding street canyons, which explains the presence of favorable airflows that reduced the air pollutants in that precise area.
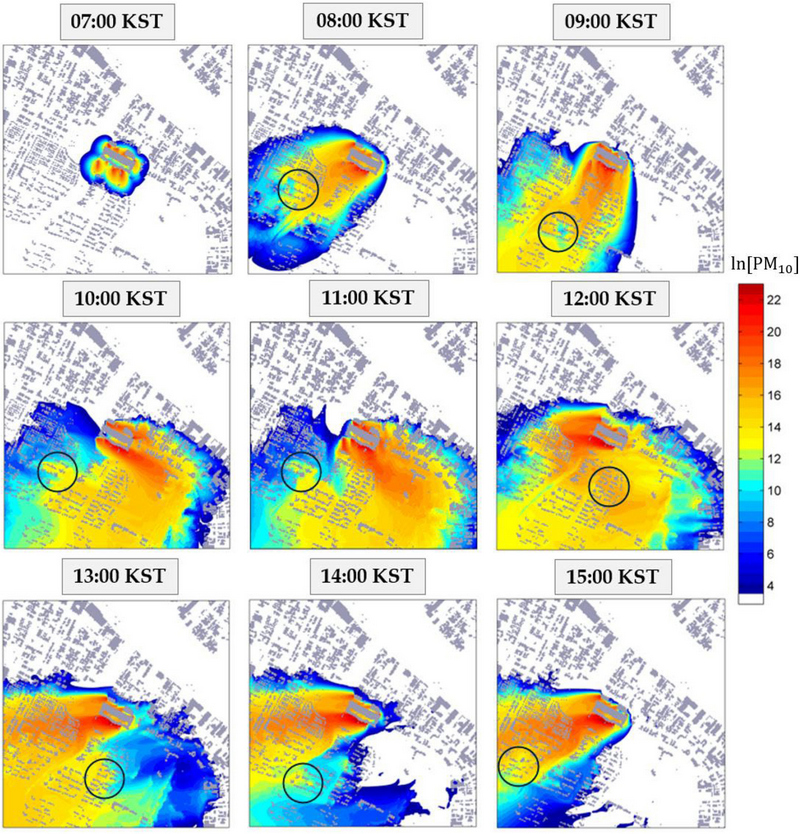
Contours of the PM10 concentrations at the surface level (z=5 m) in the absence of a heat source. Black circles indicate zones that are particularly discussed.
For the remaining time (10:00~14:00 KST), a certain phenomenon was identified in the opposite direction of the fire plume dispersion. Due to the flow circulation within the street canyons, the pollutants were transported unexpectedly outside the plume. Consequently, high-rise buildings played a significant role in the dispersion of pollutants away from the heat source, particularly at 12:00 KST, where the pollutant concentration considerably increased (as seen in the black circle in Fig. 11) compared to the buildings alongside the fire plume. The increase of pollutants in the street canyons depended greatly on the heights of the building structures and the space between them. Even though the target area had an agglomeration of buildings with different heights, such as low-rise, mid-rise, and high-rise buildings, most of their street canyons had narrow spaces, which aggravated the local air quality with a higher accumulation of pollutants and dispersion away from the fire plume.
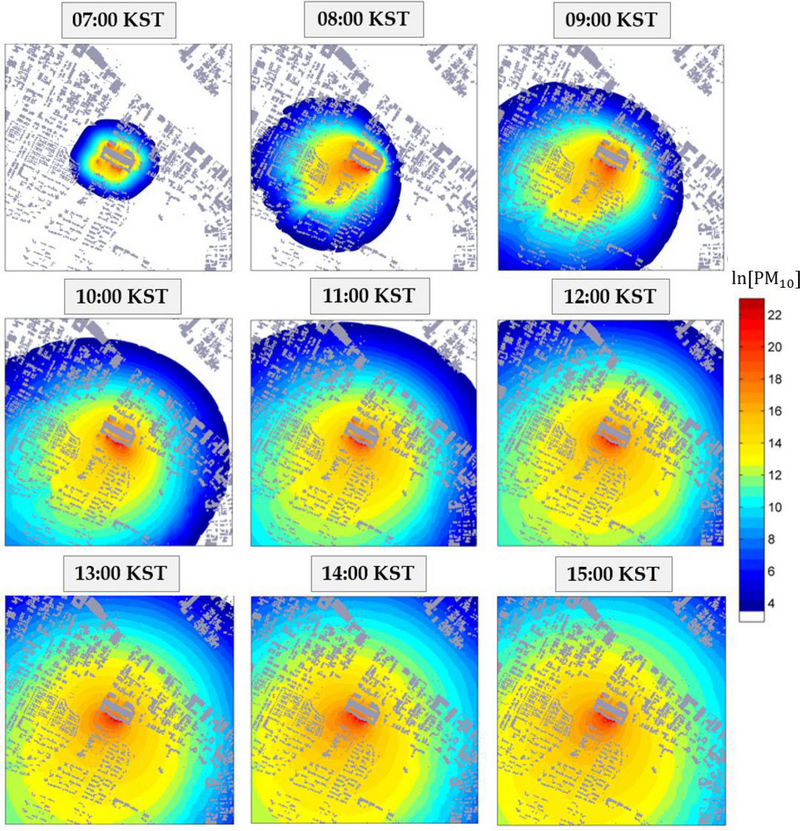
Pollutant dispersion can also be drastically affected by the presence of a heat source. Fig. 12 shows the PM10 concentrations at the surface level (z=5 m) during the fire occurrence with a heat source being considered. The concentration maintained a circumference near the heat source, and grew larger as the fire duration increased, with minimal to no change in the direction of the fire plume. Meteorological factors such as wind speed and direction played an important role in this centralized concentration of pollutants. This pollutant behavior was directly related to the fire-induced convection of wind, buoyancy, and high temperature produced by the fire (Figs. 5, 7, and 8), which contributed to the updraft of the pollutant, generating a zone of elevated pollution close to the structure. Moreover, the wind speed in the target area was relatively low during the fire event, providing conditions convective to the pollutant depending on the heatinduced convection and vertical movement, creating the localized concentration near the fire-affected building.
4. Summary and Conclusions
This study investigated the pollutant dispersion from an 8-hour accidental structural fire and its effects on the local environment using a CFD model. The airflows were observed to be highly dependent on the intense heat produced by the fire, which induced the air to be drawn towards the front of the structure where most of the fire spread. This phenomenon modified the wind speed and wind direction in the surrounding area, along with the uplift of the heated air, by creating updrafts that favored the vertical movement of air near the fire source, eventually moving this zone closer to the buildings facing the fire structure. The dispersion of the fire plume during the accident remained in the proximity of the fire structure due to the buoyancy generated by the emitted heat; however, when the wind speed increased, the fire plume was observed to disperse relatively away from the building. This was related to the area of ascending w wind component that was displaced to the left of the fire structure and closer to other buildings.
The analysis of the pollutant dispersion revealed important information regarding the influence of street canyons on the dispersion of pollutants, specifically when heat was not considered. Several street canyons exhibited lower concentrations compared to other street canyons due to their spacing and favoring airflow. Nonetheless, during most of the fire accident, the concentrations were recirculated and distributed outside the central line of the pollutant plume, and in certain cases, nearly in the opposite direction of the plume. The simulated concentrations in the presence of a heat source demonstrated the substantial influence of low wind speed and heat on the centralized and quasi-stagnation state of the pollutants near the urban fire, created by the heat-induced convection and buoyancy, as presented in the analysis of the previously mentioned. Therefore, when the local environment presented calm or low-wind conditions along with a heat source, the pollutant remained near the source area, influencing localized concentrations and the updraft of the pollutant. Consequently, if the wind speed increased, regardless of the presence of a heat source, the pollutant dispersion depended greatly on the wind flow instead of the heat convection, resulting in the dispersion of the fire and concentration plume.
The simulated results showed good agreement with those observed at the AQMS, despite the uncertainties related to numerical modeling of realistic cases. This suggests the potential for further studies on the localized diagnosis of urban areas regarding the emission of pollutants, especially during structural fire accidents. Moreover, the results demonstrated that pollutant emissions from fires could be simulated relatively well in a CFD model, considering the complexity of the fire accident and its uncertainties. Furthermore, the study was conducted in a residential area adjacent to an industrial zone, where numerous industrial fire accidents had occurred, highlighting it as an area of susceptibility. Additionally, the closest AQMS to the fire accident location was located 500 m in the opposite plume direction, and the selected station in this study was around 9 km away from the heat source. This provided evidence of how the sparse distribution of the AQMS leads to a significant underestimation of local air quality, affecting the public interpretation of the severity of these accidental emissions. Therefore, a more extensive air quality monitoring network evenly distributed in a city, especially in zones with a history of frequent fire accidents, with constant observation data being collected, could provide a more detailed assessment for accurate models, leading to better protection of the citizens, especially during fire accidents.
Although fire accidents require an immediate response, important input data for real-time simulations such as emission rates and heat release are not measured during the accident due to their uncontrollable nature. Additionally, real-time numerical simulations imply the reduction of the temporal and spatial resolution. This simplification can cause significant errors in the predicted flow field which results in a high inaccuracy. Despite the recent integration of machine learning and deep learning with CFD models to significantly reduce the computational time, CFD model simulations require a considerable time to achieve the desired accuracy, and real-time predictions of concentrations from fires using a precise numerical model are still to be developed in the future.
The present study provides valuable information to local authorities by offering insights into the use of more effective structural designs that can enhance airflow and favor the dispersion of pollutants in congested urban areas. These include street orientation aligned with the predominant local wind direction and wider spaces within street canyons, as well as identifying more suitable strategies focused on the reduction and mitigation of air pollutants produced in urban areas. Further studies simulating the pollutant dispersion from a fire under different scenarios of variations in wind speed and direction can lead to a greater understanding of the wind effects on fire accidents and vice versa. Additionally, implementing a higher resolution domain with finer grids or other CFD models such as Large Eddy Simulation (LES), could provide insights into the limitations of each approach in congested urban areas in the presence of realistic structural fires and contribute to the advancement of knowledge.
Acknowledgments
This work was supported by a Research Grant from Pukyong National University (2023).
References
- Allianz Global Corporate & Specialty (AGCS) (2018) Global Claims Review: The top causes of corporate insurance losses, Allianz Global Corporate & Specialty. https://commercial.allianz.com/content/dam/onemarketing/commercial/commercial/reports/AGCSGlobal-Claims-Review-2018.pdf (accessed on May. 24, 2024).
-
Baggio, R., Filippi, J.B., Truchot, B., Couto, F.T. (2022) Local to continental scale coupled fire-atmosphere simulation of large industrial fire plume, Fire Safety Journal, 134, 103699.
[https://doi.org/10.1016/J.FIRESAF.2022.103699]

- Bushfire CRC (2011) Inventory of major materials present in and around houses and their combustion emission products. https://www.bushfirecrc.com/sites/default/files/managed/resource/inventory.pdf, (accessed on Apr. 24, 2024).
- California Air Resources Board (CARB) (1994) Emission Inventory Procedural Manual, Vol. III: Methods for Assessing Area Source Emissions, California Air Resources Board. https://downloads.regulations.gov/EPA-HQOAR-2011-1032-0009/attachment_2.pdf, (accessed on Mar. 8, 2024).
- California Air Resources Board (CARB) (1999) Miscellaneous Emission Sources. Accidental Fires - Structural, California Air Resources Board. https://ww2.arb.ca.gov/carb-miscellaneous-process-methodologies-fires, (accessed on Mar. 8, 2024).
- Comité Technique International de prevention et d’extinction de Feu (CTIF) (2022) World Fire Statistics 2022 - Report No 27, Center for Fire Statistics (CFS) and International Association of Fire and Rescue Services (CTIF). https://www.ctif.org/sites/default/files/2022-08/CTIF_Report27_ESG_0.pdf, (accessed on Apr. 4, 2024).
-
Cui, P.Y., Zhang, J.H., Wu, Y.P., Zhang, Y., Zhou, J.Z., Luo, Y., Huang, Y.D. (2020) Wind-tunnel measurements and LES simulations of air pollutant dispersion caused by fireinduced buoyancy plume inside two parallel street canyons, Process Safety and Environmental Protection, 140, 151-169.
[https://doi.org/10.1016/J.PSEP.2020.04.047]

- Daly, A., Zannetti, P., Echekki, T. (2012) A combination of fire and dispersion modeling techniques for simulating a warehouse fire, International Journal of Safety and Security Engineering, 2(4), 368-380.
- Eastern Research Group, Inc. (ERG) (2001) Volume III: Chapter 18 - Structure Fires, Area Sources Committee - Emission Inventory Improvement Program (EIIP). https://www.epa.gov/sites/default/files/2015-08/documents/iii18_apr2001.pdf, (accessed on Mar. 8, 2024).
-
Fiates, J., Vianna, S.S.V. (2016) Numerical modelling of gas dispersion using OpenFOAM, Process Safety and Environmental Protection, 104, 277-293.
[https://doi.org/10.1016/J.PSEP.2016.09.011]

- Fire and Disaster Prevention Newspaper (FPN) (2022) Hyundai Outlet Fire [Intensive coverage], FPN 119 Plus (In Korean). https://www.fpn119.co.kr/184738, (accessed on May. 29, 2024).
-
Gannouni, S., Ben Maad, R. (2017) CFD analysis of smoke backlayering dispersion in tunnel fires with longitudinal ventilation, Fire and Materials, 41(6), 598-613.
[https://doi.org/10.1002/FAM.2394]

-
Hoffer, A., Jancsek-Turóczi, B., Tóth, Á., Kiss, G., Naghiu, A., Andrea Levei, E., Marmureanu, L., MacHon, A., Gelencser, A. (2020) Emission factors for PM10 and polycyclic aromatic hydrocarbons (PAHs) from illegal burning of different types of municipal waste in households, Atmospheric Chemistry and Physics, 20(24), 16135-16144.
[https://doi.org/10.5194/ACP-20-16135-2020]

-
Jahn, W., Zamorano, R., Calderón, I., Claren, R., Molina, B. (2023) Assessment of the Performance of FireFOAM in Simulating a Real-Scale Fire Scenario Using High Resolution Data, Fire, 6(10), 375.
[https://doi.org/10.3390/fire6100375]

-
Kim, J.J., Pardyjak, E., Kim, D.Y., Han, K.S., Kwon, B.H. (2014) Effects of building-roof cooling on flow and air temperature in urban street canyons, Asia-Pacific Journal of Atmospheric Sciences, 50(3), 365-375.
[https://doi.org/10.1007/S13143-014-0023-8]

-
Kim, J.-J., Baik, J.-J. (2010) Effects of street-bottom and buildingroof heating on flow in three-dimensional street canyons, Advances in Atmospheric Sciences 2010, 27(3), 513-527.
[https://doi.org/10.1007/S00376-009-9095-2]

-
Li, L., Li, Y., Wu, Z., Xu, P., Peng, X., Wang, H., Fan, C. (2021) Window ejected thermal plume dispersion and recirculation behavior in urban street canyon with different building height ratios under wind, Case Studies in Thermal Engineering, 27, 101220.
[https://doi.org/10.1016/J.CSITE.2021.101220]

-
Lotrecchiano, N., Sofia, D., Giuliano, A., Barletta, D., Poletto, M. (2020) Pollution Dispersion from a Fire Using a Gaussian Plume Model, International Journal of Safety and Security Engineering, 10(4), 431-439.
[https://doi.org/10.18280/ijsse.100401]

-
Manisalidis, I., Stavropoulou, E., Stavropoulos, A., Bezirtzoglou, E. (2020) Environmental and Health Impacts of Air Pollution: A Review, Frontiers in Public Health, 8, 505570.
[https://doi.org/10.3389/FPUBH.2020.00014]

-
McKenna, S.T., Hull, T.R. (2016) The fire toxicity of polyurethane foams, Fire Science Reviews 2016, 5(1), 1-27.
[https://doi.org/10.1186/S40038-016-0012-3]

-
McNamee, M., Meacham, B., van Hees, P., Bisby, L., Chow, W.K., Coppalle, A., Dobashi, R., Dlugogorski, B., Fahy, R., Fleischmann, C., Floyd, J., Galea, E.R., Gollner, M., Hakkarainen, T., Hamins, A., Hu, L., Johnson, P., Karlsson, B., Merci, B., Weckman, B. (2019) IAFSS agenda 2030 for a fire safe world, Fire Safety Journal, 110, 102889.
[https://doi.org/10.1016/J.FIRESAF.2019.102889]

- Minnesota Pollution Control Agency (2023) Calculating emissions. https://www.pca.state.mn.us/business-with-us/calculating-emissions, (accessed on Apr. 29, 2023).
-
Mun, D.-S., Kim, M.-J., Kim, J.-J. (2021) A Numerical Study on the Effects of Meteorological Conditions on Building Fires Using GIS and a CFD Model, Korean Journal of Remote Sensing [In Korean], 37(3), 395-408.
[https://doi.org/10.7780/KJRS.2021.37.3.3]

- Palampigik, A., Vasilopoulos, K., Lekakis, I., Sarris, I. (2023) Risk Assessment of Toxic Pollutant Dispersion after a Methane Pool Fire Accident in a Street Canyon, Environmental Sciences Proceedings 2023, 26(1), 132pp.
- Patankar, S. (1980) Numerical Heat Transfer and Fluid Flow. Edited by W.J. Minkowycz & E.M. Sparrow, 1st Ed. McGraw-Hill Book Company, New York, 214pp.
-
Pesic, D.J., Blagojevic, M.D.J., Zivkovic, N.V. (2014) Simulation of wind-driven dispersion of fire pollutants in a street canyon using FDS, Environmental Science and Pollution Research, 21(2), 1270-1284.
[https://doi.org/10.1007/S11356-013-1999-9]

-
Rahman, F.S., Tannous, W.K., Avsar, G., Agho, K.E., Ghassempour, N., Harvey, L.A. (2023) Economic Costs of Residential Fires: A Systematic Review, Fire 2023, 6(10), 399pp.
[https://doi.org/10.3390/FIRE6100399]

-
Sha, H., Qi, D. (2020) A Review of High-Rise Ventilation for Energy Efficiency and Safety, Sustainable Cities and Society, 54, 101971.
[https://doi.org/10.1016/J.SCS.2019.101971]

-
Shelke, A.V., Gera, B., Maheshwari, N.K., Singh, R.K. (2020) CFD Simulation of Fuel Dispersion and Fireball Formation Associated with Aircraft Crash on NPP Structures, Combustion Science and Technology, 192(8), 1520-1549.
[https://doi.org/10.1080/00102202.2019.1612383]

-
Tang, Z., Maroto-Valer, M.M., Andrésen, J.M., Miller, J.W., Listemann, M.L., McDaniel, P.L., Morita, D.K., Furlan, W.R. (2002) Thermal degradation behavior of rigid polyurethane foams prepared with different fire retardant concentrations and blowing agents, Polymer, 43(24), 6471-6479.
[https://doi.org/10.1016/S0032-3861(02)00602-X]

- Versteeg, H.K., Malalasekera, W. (2007) An introduction to computational fluid dynamics: the finite volume method, 2nd Ed., Pearson Education Limited, England, 517pp.
- World Health Organization (WHO) (2014) Injuries and Violence: The Facts 2014, World Health Organization (WHO) & Social Determinants of Health (SDH). https://www.who.int/publications/i/item/9789241508018, (accessed on Apr. 24, 2024).
Gonzalez-Perez Alejandra (부경대학교 지구환경시스템과학부 환경대기과학전공 석사과정생) (alegope@pukyong.ac.kr)
문다솜 (부경대학교 지구환경시스템과학부 환경대기과학전공 박사수료생) (dsmun@pukyong.ac.kr)
노주환 (부경대학교 지구환경시스템과학부 환경대기과학전공 석사과정생) (jhrho@pukyong.ac.kr)
김재진 (부경대학교 지구환경시스템과학부 교수) (jjkim@pknu.ac.kr)

