2018~2021년 안면도에서 관측된 황사 (Asian dust)와 연무 (Haze)에 따른 에어로졸 물리, 광학 및 화학 특성 비교
Abstract
We analyzed the characteristics of aerosol particles contained in Haze and Asian dust using physical, optical, and chemical properties observed in Anmyeon-do over four years (2018~2021). Asian dust and haze are classified by the mass concentration of PM10 and PM2.5. A total of 28 Asian dust cases were observed with a PM10 mass concentration of 105.8±120.0 µg/m3, which was about three times higher than the average during study periods. There were 138 haze days with a PM2.5 mass concentration of 51.6±16.4 µg/m3. The scattering coefficient as an optical property of aerosols was 180.5±114.0 Mm-1 for haze cases, which was about 1.7 times higher than Asian dust cases. The absorption coefficient was found to be 12.7±7.9 Mm-1 and 9.3±6.7 Mm-1 for haze and Asian dust cases, respectively. The scattering Ångström exponent was 1.46±0.32 (0.88±0.59) for haze (Asian dust), indicating the dominance of coarse particles in Asian dust. Meanwhile, Asian dust cases had a high proportion of soil-derived chemical components such as Al (23%), Fe (18%), and Ca (14%), while haze had the highest proportion of the anthropogenic component S (37%). Also, for the ionic composition analysis, haze cases had a high percentage of secondary aerosols such as NO3- (42%), SO42- (32%), and NH4+ (23%). The backward trajectory analysis using the HYSPLIT model revealed that the Asian dust was transported to Korea through the Gobi Desert, Inner Mongolia, and Manchuria in northwestern China, known as major sources of Asian dust. For haze, a relatively short trajectory originating from Balhae Bay was found, suggesting that the emitted air pollutants were not likely to spread rapidly but move slowly or stagnate, creating secondary aerosols and causing haze.
Keywords:
Asian dust, Haze, Aerosol type, Optical properties, HYSPLIT1. 서 론
에어로졸은 대기 중에 자연적, 인위적으로 존재 하는 여러 종류의 물질들로 구성된 입자를 총칭하며 (Jeong et al., 2022), 태양복사를 산란 (냉각효과)·흡수 (온실효과)하고 구름형성 과정에 영향을 주며, 전지구 평균적으로 음 (-)의 복사강제력을 갖고 있다 (IPCC, 2021). 아시아 지역에서는 대기 중의 에어로졸에 의한 대기오염으로 북반구의 기후 패턴이 바뀌고 있으며, 에어로졸에 의한 대기질이 인체의 건강에 직접적인 영향을 주면서 관심이 더욱 커지고 있다 (Honda et al., 2017). 또한 반응가스와 결합하여 산성비, 스모그, 시정감소 등의 원인이 된다. 특히, 황사 (Asian dust)와 연무 (Haze)는 에어로졸로 인해 발생하는 대표적인 기상현상으로 잘 알려져 있다.
황사는 먼지 연무의 일종으로 몽골과 중국 북부에 걸친 고비사막, 내몽골고원, 황토고원 등에서 발생하여 장거리 이동을 통해 발원지뿐만 아니라 풍하측에도 영향을 미친다 (Jeong et al., 2023a). 연무는 시정 1 km 이상으로 습도가 비교적 낮을 때 대기 중에 연기·먼지 등 미세한 입자에 의해 공기의 색이 우윳빛으로 부옇게 보이는 현상으로, 대기 중 초미세먼지 (PM2.5)의 질량농도와 밀접한 관계가 있다. 황사와 연무 등 대기 중 에어로졸에 관한 연구는 물리, 광학, 화학적 특성 연구뿐만 아니라 위성, 수치모델 등 광범위한 분야에서 수행되고 있다.
황사와 연무 현상별 에어로졸의 질량농도와 화학조성에 관한 연구 (Jeong et al., 2023b; Zhang et al., 2023; Jeon, 2022; Song et al., 2016; Park et al., 2012)와 공기역학입자계수기 (Aerodynamic Particle Sizer, APS)와 광학입자계수기 (Optical Particle Counter, OPC) 등을 이 용한 에어로졸의 입경별 부피, 수농도 분포에 관한 연구 (Shim et al., 2022; Shin et al., 2022; Lee et al., 2008), 광산란계수측정기 (Nephelometer), 광흡수계수측정기 (Aethalometer), 복사계 (radiometer) 등의 장비에서 관측된 에어로졸의 광학 특성에 관한 연구 (Wen et al., 2021; Han et al., 2015; Liu et al., 2013), 위성과 수치모델을 이용한 황사와 연무 판별에 관한 연구 (Lee and Kang, 2023; Tao et al., 2022) 등 물리, 광학, 화학적 특성에 관한 다양한 연구가 이루어지고 있다. 그러나 에어로졸의 물리, 광학적 특성과 화학조성 성분은 시간적으로 다양하고 지역성이 크기 때문에 특성과 생성기원을 파악하기 위해서는 다양한 지점에서 다양한 사례에 대한 통합적인 연구가 필요하다 (Song et al., 2015). 따라서 본 연구에서는 국내에서 관측된 에어로졸의 다양한 지역적 특성을 분석하기 위해 세계기상기구 (World Meteorological Organization, WMO)의 지구대기감시 (Global Atmosphere Watch, GAW) 프로그램 지역급 관측소로 등록되어 있는 안면도 기후변화감시소에서 2018~2021년 관측된 에어로졸 황사, 연무 사례를 선정하고 이에 대한 물리, 광학, 화학적 특성을 비교하였다.
2. 연구 방법
그림 1에 표시한 안면도 기후변화감시소 (충남 태안군 안면읍, 36°32Nʹ, 126°19Eʹ)는 한반도 서해안에 위치하여 있으며, 북동쪽 약 35 km 떨어진 곳에 화력발전소가 있으며, 반경 100 km 이내에 산업단지가 존재하고, 서쪽은 갯벌로 이루어진 해안이 존재한다 (Jeong et al., 2022).
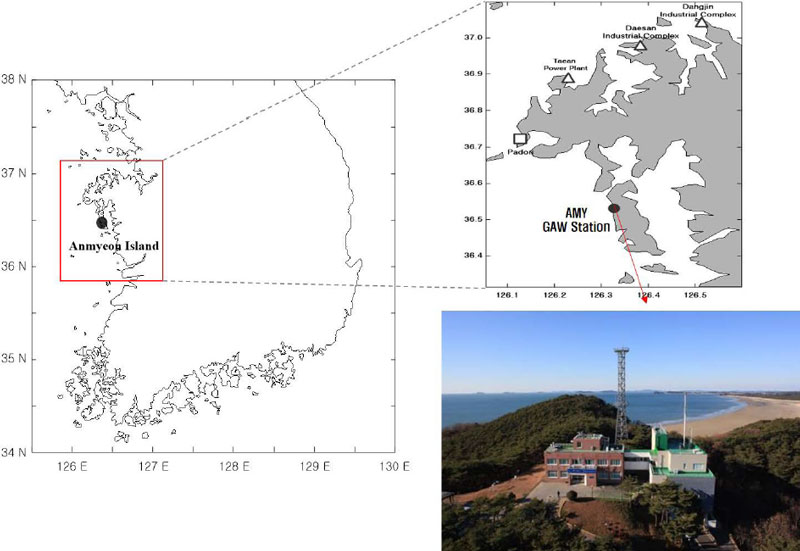
Graphical location of the sampling site at Anmyeon-do in South Korea and an external view of the Anmyeon-do GAW station.
에어로졸의 물리 특성인 입경별 수농도 분포는 공기역학입자계수기 (Aerodynamic Particle Sizer, TSI Inc., TSI3321, APS)를 사용하였다. APS는 0.5~20.0 µm 입경의 에어로졸을 52개의 구간에 대해 수농도를 관측하며, 불확실성은 약 ±10%이다 (Wang et al., 2002). 에어로졸의 광학 특성은 광산란계수측정기 (Nephelo- meter, TSI Inc., TSI 3563)와 광흡수계수측정기 (Aetha-lometer, Magee Sci., AE-31)를 사용하였으며, 산란각 오차 보정 등의 후처리는 Anderson and Ogren (1998), Hansen et al. (1984) 등 선행 연구에서 제시된 방법을 적용하였다. 또한, 모든 물리, 광학 관측자료는 표준상태 (273.15 K, 1,013 hPa)로 보정 후 일평균 자료를 분석에 사용하였다. 자료의 품질관리 및 통계 방법은 국립기상과학원에서 매년 발간하는 지구대기감시보고서에 자세히 설명되어 있다 (NIMS, 2021). 에어로졸의 화학성분 분석을 위한 PM10 시료의 채취는 2대의 저용량공기채취기 (Low Volume Air Sampler, APM Eng., Korea, PMS-104)를 이용하여, “WMO/GAW Report No. 227”에 따라 16.7 L/min의 유량으로 24시간 채취하였다. 원소와 이온성분 분석을 위해 사용한 여지는 Teflon 재질의 여지 (Pall co., 47 mm, pore size 2.0 µm, USA)를 사용하였다. 원소성분은 대기오염 공정시험기준과 미국 EPA의 방법을 참고하여, 마이크로파 산분해법으로 전처리 후, ICP-MS (PerkinElmer, ELAN DRC-e, USA) 및 ICP-OES (PerkinElmer, OPTIMA 7300DV, USA)를 사용하여 20개 항목 (Al, Ba, Ca, Cd, Co, Cr, Cu, Fe, K, Mg, Mn, Mo, Na, Ni, Pb, S, Sr, Ti, V, Zn)을 분석하였다. 이온성분은 이온크로마토그래피법 (IC)으로 8개 항목 (NH4+, Na+, K+, Ca2+, Mg2+, SO42-, NO3-, Cl-)을 분석하였으며, 자세한 전처리 및 분석 방법, 검출한계 등은 Song et al. (2016)에 제시되어 있다. 본 연구에 사용된 관측 및 분석 장비는 표 1과 같다.
2018~2021년 관측된 자료를 황사와 연무 사례로 나누어 분석을 진행하였다. 연구기간 연무 사례 (Haze)는 대기환경기준인 일 평균 PM2.5 농도가 35 µg/m3를 초과하는 날로 선정하였으며, 황사 사례 (Asian dust)는 기상청에서 발표한 황사 관측일 (총 29일)과 일 평균 PM10 농도가 150 µg/m3 초과한 경우 (총 9일)로 하였다. PM2.5 농도 35 µg/m3를 초과하고 동시에 PM10 농도가 150 µg/m3를 초과한 경우는 편의상 황사 사례에 포함하였다.
3. 연구 결과
3. 1 에어로졸 물리 특성
앞 장에서 규정한 선정 조건으로 분류된 사례별 PM2.5와 PM10 질량농도는 표 2에 제시되었다. 연구기간 황사 사례는 총 38일이었으며, PM10 질량농도는 105.8±120.0 µg/m3로 연구기간 평균 34.4±33.7 µg/m3에 비해 약 3배 높았다. PM2.5 질량농도는 39.3±43.1 µg/m3로 연구기간 전체 평균 (20.7±20.2 µg/m3)에 비해 약 2배 높았다. 연무 사례는 총 138일로 황사 사례보다 약 3.6배 많았고, PM10 질량농도는 66.0±19.0 µg/m3, PM2.5 질량농도는 51.6±16.4 µg/m3로 관측되었다 (표 2).
자세한 에어로졸 물리 특성 분석을 위해 APS 관측자료를 활용하여 입경별 부피농도를 산출하였다 (그림 2). 입경별 부피농도는 입경 (Dp)에 대한 수농도 (dN/dlogDp)로 표출되는 관측자료의 모든 입자가 동일한 조성을 가진 성분이라고 가정했을 때 부피가 질량에 비례한다는 Hobbs (2000)의 관계식을 사용하였다.
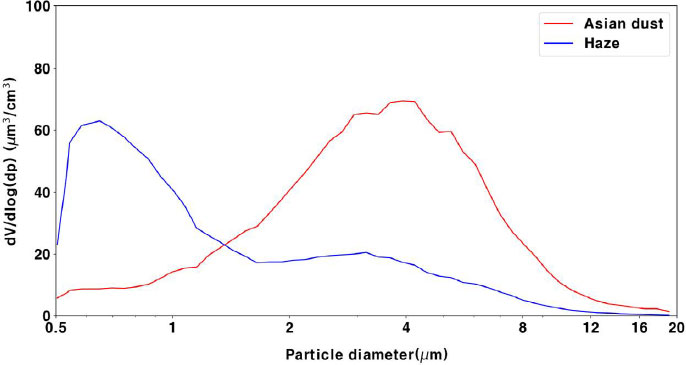
Aerosol volume size distribution for Asian dust (red) and haze (blue) cases measured at Anmyeon-do GAW station.
황사 사례의 경우 2.458~5.048 µm에 해당하는 구간 부피농도의 값이 증가하는 경향을 보였으며, 특히 3.051~3.278 µm 구간에서 69.3 µm3/cm3로 가장 높았다. 연무 사례는 0.523~1.037 µm에 해당하는 입자크기 구간에서 부피농도가 높았고, 그중 특히 0.626~0.673 µm의 미세입자 구간에서 60.5 µm3/cm3로 가장 높았다.
3. 2 에어로졸 광학 특성
사례별 550 nm 파장의 광산란계수와 광흡수계 수 값의 분포를 그림 3에 제시하였다. 광산란계수는 연무 사례의 경우 180.5±114.0 Mm-1로 황사 사례 (104.6±106.9 Mm-1)에 비해 약 1.7배 높았고, 두 사 례 모두 연구기간 안면도에서 관측된 평균 (77.1±5.8 Mm-1)보다 높았다. 광흡수계수는 연무 사례 (12.7±7.9 Mm-1), 황사 사례 (9.3±6.7 Mm-1)로 약 1.3배 차이가 나타났으며, 연구기간 안면도는 평균 7.1±4.9 Mm-1로 나타났다. 이는 입자가 미세할수록 에어로졸 광산란에 기여하는 바가 큰 것을 의미하며, 추후 에어로졸의 입경별 부피, 수 농도와 광산란계수의 상관성에 대한 추가연구가 이루어져야 할 것이다. 또한, 대부분의 황사 시에 연무가 혼재된 상태로 유입되기 때문에 연구기간 연무, 황사 사례 모두 안면도의 평균값보다 높았던 것으로 사료된다.
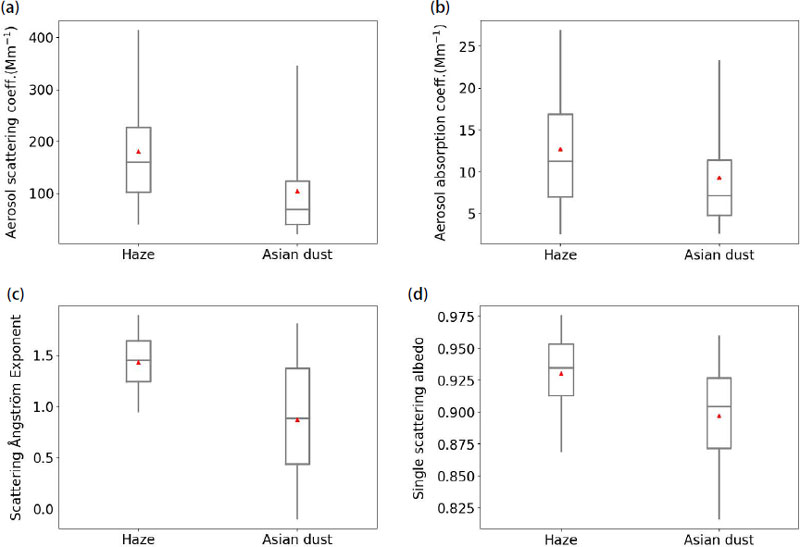
Aerosol optical properties for each case. (a) 550 nm aerosol scattering coefficient, (b) 550 nm aerosol absorption coefficient, (c) scattering Ångström exponent, and (d) single scattering albedo. The box and whisker plot illustrates percentiles (10th, 25th, 75th, 90th) with a dot indicating the mean and solid line indicating the median.
파장별 광산란계수로 산출되는 산란옹스트롬지수 (Scattering Ångström Exponent, SAE, 450~700 nm)는 연무 사례에서는 1.44±0.30, 황사 사례에서는 0.88±0.59로 황사 사례 때 1 이하의 낮은 값을 나타내었으며, 이는 조대입자가 우세한 특징을 잘 나타내는 것으로 해석된다. 에어로졸의 타입을 분류하는 주요 요소 중 하나인 단일산란알베도 (Single Scattering Albedo, SSA)는 에어로졸 광소멸계수에 대한 광산란계수의 비로 계산되며, 1에 가까울수록 완전한 산란을, 0에 가까울수록 완전한 흡수를 의미한다 (Russell et al., 2014). 연무 사례의 평균 SSA는 0.93±0.03으로 황사 사례의 평균 0.89±0.04보다 높았다. 사례별 광학 특성을 표 3에 정량적으로 다시 기술하였다.
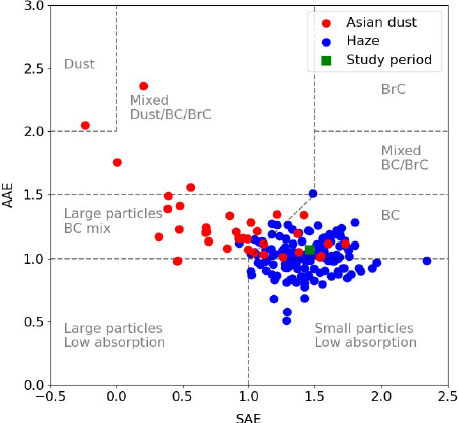
Schmeisser et al. (2017)에서 제안된 방법론에 따라 안면도에서 관측한 SAE와 AAE를 이용하여 에어로 졸을 유형별로 구분한 결과는 그림 4와 같다. 연무 사례의 에어로졸 유형은 주로 BC, Small particles/Low absorption으로 구분되었고, 황사 사례는 일부 Mixed Dust 유형으로 분류되었으나, 평균적으로 Large particles/BC mix 혼합 유형이 우세하였다.
3. 3 에어로졸 화학 특성
황사 사례 PM10 원소성분 분석 결과 주로 토양 기 원 성분들의 농도가 높았으며, Al 농도가 2244.5 ng/m3 (23.3%)로 가장 높고 그 뒤로 Fe (17.7%), Ca (14.0%) 등의 순이었다. 황사 사례 PM2.5 성분은 S 농도가 284.2 ng/m3 (31.2%)로 가장 높았으며, 그 뒤로 Al (15.9%), Fe (13.9%) 등의 순이었다. 연무 사례는 PM10, PM2.5 모두 원소성분은 S 성분이 가장 높았고, 각각 594.1 ng/m3 (23.3%), 314.2 ng/m3 (37.1%)였다.
특히, PM10 원소성분의 질량농도는 황사 사례 농도의 합 (9618.0 ng/m3)이 연무 사례 농도의 합 (2549.3 ng/m3)보다 약 3.8배 높았다. 특히 토양 기원 성분들의 농도에서 큰 차이를 나타내어 황사와 연무의 원소성분 조성에 대한 특성을 잘 나타내고 있다 (표 4).
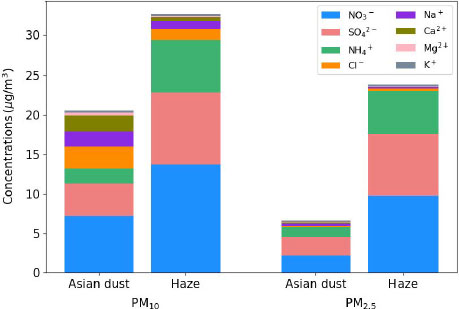
이온성분을 분석한 결과, 황사 사례에 비해 연무 사례에서 PM10, PM2.5 모두 이온성분의 질량농도가 높았다 (그림 5). PM2.5의 황사 사례 대비 연무 사례의 주요 이온성분을 살펴보면 NO3- (4.5배), NH4+ (4.3배), SO42- (3.3배) 등 2차 생성 에어로졸의 주요성분에서 큰 차이를 보였다. 이는 고농도 에어로졸 입자는 주로 2차로 생성된 에어로졸인 황산암모늄염 ((NH4)2SO4), 황산질산염 (NH4NO3) 등으로 구성되어 있다는 선행 연구의 결과와 일치한다 (Link et al., 2017; Du et al., 2010). 이는 황사 사례에서는 토양 기원의 에어로졸에 의해 원소성분이 증가하여 질량농도가 증가하는 반면 연무 사례에서는 인위적 기원의 2차 생성 에어로졸 에 의해 이온성분 및 질량농도가 증가하는 것을 의미한다.
에어로졸 유입경로를 확인하기 위해 미국해양대기청의 HYSPLIT (Hybrid Single-Particle Lagrangian Integrated Trajectory) 모델과 GDAS (Global Data Assimilation System) 자료를 사용하여 각 사례의 평균 유입경로를 안면도 관측소 고도 500 m에 대한 72시간 역궤적 분석을 수행하였다 (그림 6).
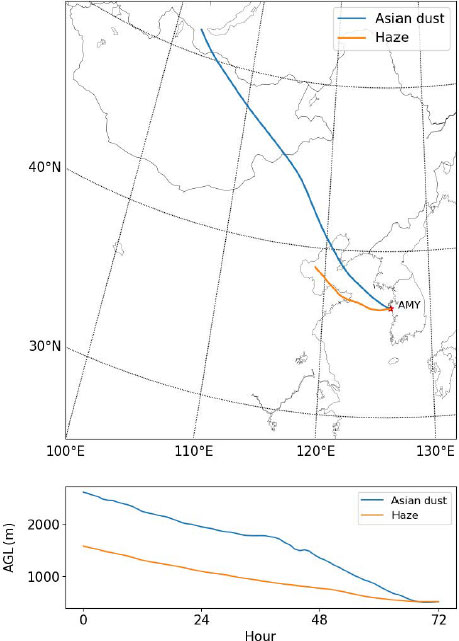
Mean 72-hour backward trajectory patterns for the Asian dust (blue line) and haze (orange line) cases, respectively.
황사 사례의 경우 주요 황사발원지인 중국 북서부 지역과 내몽골 및 고비사막을 거쳐 우리나라로 유입되는 것으로 나타났다. 궤적의 길이가 긴 것은 공기의 흐름이 빠르다는 것을 의미하며, 황사발원지에서 높은 고도 (2500 m)에서부터 빠르게 유입된 것을 알 수 있다. 이에 반면, 연무 사례는 산둥반도를 거쳐 황사 사례보다 느리게 낮은 고도로 유입되는 것으로 나타났다.
4. 결 론
본 연구는 4년 (2018~2021년) 동안 안면도 기후변화 감시소에서 관측된 에어로졸 물리, 광학, 화학 자료를 활용하여 에어로졸의 황사, 연무의 특성을 분석하였다.
연구기간 황사와 연무의 구분은 PM10, PM2.5 질량농도를 기준으로 하였으며, 황사 사례는 총 38일로 PM10 질량농도는 105.8±120.0 µg/m3였으며, 연구기 간 (2018~2021) 평균 34.4±33.7 µg/m3보다 약 3배 높았다. 연무 사례는 총 138일로 PM2.5 질량농도는 51.6± 16.4 µg/m3였다. APS로 관측한 입경별 에어로졸 부피농도는 황사 사례 3.051~3.278 µm 구간에서 높은 부피농도를 나타냈으며, 연무 사례는 0.523~1.037 µm 구간에서 가장 높았다. 에어로졸의 광학 특성인 광산란계수는 연무 사례 180.5±114.0 Mm-1로 황사 사례 104.6±106.9 Mm-1에 비해 약 1.7배 높고, 광흡수계수는 연무 사례 (12.7±7.9 Mm-1), 황사 사례 (9.3±6.7 Mm-1)로 나타났다. 산란옹스트롬지수는 연무 사례 1.43±0.32, 황사 사례 0.88±0.59로 황사 시 조대입자가 우세한 특징을 잘 나타냈다. 에어로졸 화학성분은 황사 사례 토양 기원의 원소성분들인 Al (23.3%), Fe (17.7%), Ca (14.0%) 등이 높았다. 이온성분 분석 결과 연무 사례는 NO3- (41.5%), SO42- (32.1%), NH4+ (23.0%)로 2차 에어로졸의 구성성분이 높았다.
분류한 사례에 대해 HYSPLIT 모델을 이용하여 역궤적 분석을 수행한 결과 황사 사례의 경우 주요 황사발원지인 중국 북서부의 만주지역과 내몽골 및 고비사막을 지나 우리나라로 유입되는 것으로 나타났다. 연무 사례의 경우 산둥반도를 지나 우리나라로 유입되는 것으로 나타났다. 연무 사례 시 궤적의 길이가 짧은 것으로 보아 배출된 대기오염물질이 대기 중으로 확산되지 않고 천천히 이동, 정체되면서 2차 에어로졸 생성을 통해 우리나라에 연무를 발생시키는 것을 알 수 있었다.
현재 단일 황사, 연무 사례에 대한 연구는 지속적으로 이루어지고 있지만, 다년도의 관측자료에 대한 통계분석은 부족한 실정이다. 향후 축적되어 있는 다년도의 관측자료를 활용하여 에어로졸의 물리, 광학, 화학 특성 비교 연구를 종합적으로 수행한다면 에어로졸의 유형과 기원을 파악하는 데 기여할 수 있을 것이다.
Acknowledgments
이 연구는 ‘황사·연무 감시 및 예보기술 개발 (KMA 2018-00521)’의 지원으로 수행되었습니다.
References
-
Anderson, T.L., Ogren, J.A. (1998) Determining aerosol radiative properties using the TSI 3563 integrating Nephelometer, Aerosol Science and Technology, 29, 57-69.
[https://doi.org/10.1080/02786829808965551]

- Du, H., Kong, L., Cheng, T., Chen, J., Yang, X., Zhang, R., Han, Z., Ma, Y. (2010) Insights into ammonium particle-to-gas conversion: non-sulfate ammonium coupling with nitrate and chloride, Aerosol and Air Quality Research, 10(6), 589-595.
-
Han, Y., Wu, Y., Wang, T., Xie, C., Zhao, K., Zhuang, B., Li, S. (2015) Characterizing a persistent Asian dust transport event: Optical properties and impact on air quality through the ground-based and satellite measurements over Nanjing, China, Atmospheric Environment, 115, 304-316.
[https://doi.org/10.1016/j.atmosenv.2015.05.048]

-
Hansen, A., Rosen, H., Novakov, T. (1984) The Aethalometer - an instrument for the real-time measurement of optical absorption by aerosol particles, Science of The Total Environment, 36, 191-196.
[https://doi.org/10.1016/0048-9697(84)90265-1]

- Hobbs, P.V. (2000) Introduction to atmospheric chemistry, Cambridge Univ. Press, 262pp.
- Honda, A., Sawahara, T., Hayashi, T., Tsuji, K., Fukushima, W., Oishi, M., Kitamura, G., Kudo, H., Ito, S., Yoshida, S., Ichinose, T., Ueda, K., Takano, H. (2017) Boiological factor related to Asian sand dust particles contributes to the exacerbation of asthma, Journal of Applied Toxicology, 37(5), 583-590.
- Intergovernmental Panel on Climate Change (IPCC) (2021) Climate Change 2021, the physical science basis. Contribution of working group I to the fifth assessment report of the intergovernmental panel on climate change.
-
Jeon, B.-I. (2022) Characteristics of Meteorological Parameters and Ionic Components in PM2.5 during Asian dust Events on November 28 and 30, 2018 at Busan, Journal of Environmental Science International, 31(6), 515-524.
[https://doi.org/10.5322/JESI.2022.31.6.515]

-
Jeong, J.-Y., Ko, H.-J., Seo, W.-I., Kim, J.E., Boo, K.-O. (2023b) Size-segregated Aerosol Chemical Characteristics in According with Pathways of the Asian dust Observed in 2014 and 2015 in Jeju, Korea, Journal of Korean Society for Atmospheric Environment, 39(2), 202-216, (in Korean with English abstract).
[https://doi.org/10.5572/KOSAE.2023.39.2.202]

-
Jeong, M.J., Yoo, H.-J., Oh, S.-M., Joo, S.J., Boo, K.-O. (2023a) Analysis of Asian Dust Outbreaks and Correlation with Meteorological Factors Using Erdene Dust Monitoring Tower, Journal of Korean Society for Atmospheric Environment, 39(2), 190-210, (in Korean with English abstract).
[https://doi.org/10.5572/KOSAE.2023.39.2.190]

-
Jeong, M.J., Yoo, H-J., Seo, W.-I., Shin, D.-G., Ko, H.-J., Oh, S.M., Chung, C.-Y., Kim, J.E. (2022) Analysis of Aerosol Characteristics through Stereoscopic Observation of the West Sea during the 2019 YES-AQ Campaign, Journal of Korean Society for Atmospheric Environment, 38(6), 823-835, (in Korean with English abstract).
[https://doi.org/10.5572/KOSAE.2022.38.6.823]

-
Lee, W.J., Kang, M.S. (2023) A Study on the updating of Asian dust Source Regions in Asian dust Aerosol Model Version 3 (ADAM3) in KMA, Journal of Korean Society for Atmospheric Environment, 39(3), 294-307.
[https://doi.org/10.5572/KOSAE.2023.39.3.294]

- Lee, Y.-G., Cho, C.-H., Kim, M.-S. (2008) Developing Method for Detecting the Asian dust event Among High PM10 events Using Aerodynamic Particle Sizer (APS), Atmosphere, 18(1), 25-32.
- Link, M.F., Kim, J., Park, G., Lee, T., Park, T., Babar, Z.B., Sung, K., Kim, P., Kang, S., Kim, J.S., Choi, Y., Son, J., Lim, H.J., Farmer, D.K. (2017) Elevated production of NH4NO3 from the photochemical processing of vehicle exhaust: Implications for air quality in the Seoul Metropolitan Region, Atmospheric Environment, 156, 95-101.
-
Liu, Z., Fairlie, T.D., Uno, I., Huang, J., Wu, D., Omar, A., Kar, J., Vaughan, M., Rogers, R., Winker, D., Trepte, C., Hu, Y., Sun, W., Lin, B., Cheng, A. (2013) Transpacific transport and evolution of the optical properties of Asian dust, Journal of Quantitative Spectroscopy & Radiative Transfer, 116, 24-33
[https://doi.org/10.1016/j.jqsrt.2012.11.011]

- National Institute of Meteorological Sciences (NIMS) (2021) Report of global atmosphere watch 2021, Aerosol optical characteristics, 5.3, 129.
-
Park, S.M., Moon, K.J., Park, J.S., Kim, H.J., Ahn, J.Y., Kim, J.S. (2012) Chemical Characteristics of Ambient Aerosol during Asian dusts and High PM Episodes at Seoul Intensive Monitoring Site in 2009, Journal of Korean Society for Atmospheric Environment, 28(3), 282-293, (in Korean with English abstract).
[https://doi.org/10.5572/KOSAE.20112.28.3.282]

-
Russell, P.B., Kacenelenbogen, M., Livingston, J.M., Hasekamp, O.P., Burton, S.P., Schuster, G.L., Johnson, M.S., Knobelspiesse, K.D., Redemann, J., Ramachandran, S. Holben, B. (2014) A multiparameter aerosol classification method and its application to retrievals from spaceborne polarimetry, Journal of Geophysical Research: Atmospheres, 119(16),
[https://doi.org/10.1002/2013JD021411]

-
Schmeisser, L., Andrews, E., Ogren, J.A., Sheridan, P., Jefferson, A., Sharma, S., Kim, J.E., Sherman, J.P., Sorribas, M., Kalapov, I., Arsov, T., Angelov, C., Mayol-Bracero, O.L., Labuschagne, C., Kim, S.W., Hoffer, A., Lin, N.H., Chia, H.P., Bergin, M., Sun, J., Liu, P., Wu, H. (2017) Classifying aerosol type using in situ surface spectral aerosol optical properties, Atmospheric Chemistry and Physics, 17(19), 12097-12120.
[https://doi.org/10.5194/acp-17-12097-2017]

-
Shim, K.S., Kim, M.H., Lee, H.J., Nishizawa, T., Shimizu, A., Kobayashi, H., Kim, C.-H., Kim, S.-W. (2022) Exacerbation of PM2.5 concentration due to unpredictable weak Asian dust storm: A case study of an extraordinarily longlasting spring haze episode in Seoul, Korea, Atmospheric Environmnet, 287.
[https://doi.org/10.1016/j.atmosenv.2022.119261]

-
Shin, D.-G., Kim, J.E., Chung, C.-Y., Yoo, H.-J. (2022) Aerosol physical characteristics over the Yellow Sea using optical particle counter measurement data onboard Gisang 1 vessel during YES-AQ campaign, Journal of Korean Society for Atmospheric Environment, 38(2), 203-219, (in Korean with English abstract).
[https://doi.org/10.5572/KOSAE.2022.38.2.203]

-
Song, J.-M., Bu, J.-O., Yang, S.-H., Lee, J.-Y., Kim, W.-H., Kang, C.-H. (2016) Influences of Asian dust, Haze, and Mist Events on Chemical Compositions of Fine Particulate Matters at Gosan Site, Jeju Island in 2014, Journal of Korean Society for Atmospheric Environment, 32(1), 67-81, (in Korean with English abstract).
[https://doi.org/10.5572/KOSAE.2016.32.1.067]

-
Song, S.-J., Kim, J.E., Lim, E.-H., Cha, J.-W., Kim, J. (2015) Physical, Chemical and Optical Properties of an Asian dust and Haze Episodes Observed at Seoul in 2010, Journal of Korean Society for Atmospheric Environment, 31(2), 131-142, (in Korean with English abstract).
[https://doi.org/10.5572/KOSAE.2015.31.2.131]

-
Tao, M., Chen, L., Wang, J., Wang, L., Wang, W., Lin, C., Gui, L., Wang, L., Yu, C., Wang, Y. (2022) Characterization of dust activation and their prevailing transport over East Asia based on multi-satellite observations, Atmospheric Research, 265.
[https://doi.org/10.1016/j.atmosres.2021.105886]

-
Wang, J., Flagan, R.C., Seinfeld, J.H., Jonsson, H.H., Collins, D.R., Russell, P.B., Schmid, B., Redemann, J., Livingston, J.M., Gao, S., Hegg, D.A., Welton, E.J., Bates, D. (2002) Clearcolumn radiative closure during ACE-Asia: Comparison of multiwavelength extinction derived from particle size and composition with results from Sun photometry, Journal of Geophysical Research: Atmospheres, 107(D23).
[https://doi.org/10.1029/2002JD002465]

-
Wen, H., Zhou, Y., Xu, X., Wang, T., Chen, Q., Chen, Q., Li, W., Wang, Z., Huang, Z., Zhou, T., Shi, J., Bi, J., Ji, M., Wang, X. (2021) Water-soluble brown carbon in atmospheric aerosols along the transport pathway of Asian dust: Optical properties, chemical compositions, and potential sources, Science of The Total Environment, 789.
[https://doi.org/10.1016/j.scitotenv.2021.147971]

-
Zhang, T., Zheng, M., Sun, X., Chen, H., Wang, Y., Fan, X., Pan, Y., Quan, J., Liu, J., Wang, Y., Lyu, D., Chen, S., Zhu, T., Chai, F. (2023) Environmental impacts of three Asian dust events in the northern China and the northwestern Pacific in spring 2021, Science of The Total Environment, 859.
[https://doi.org/10.1016/j.scitotenv.2022.160230]

정민재 (국립기상과학원 지구대기감시연구과 연구원) (minjaeaa@korea.kr)
유희정 (국립기상과학원 지구대기감시연구과 연구사) (heejuyoo@korea.kr)
고희정 (국립기상과학원 지구대기감시연구과 연구사) (khj0614@korea.kr)
오상민 (국립기상과학원 지구대기감시연구과 연구원) (sangmin80@korea.kr)
황승언 (국립기상과학원 기후연구부 연구위원) (compassion@korea.kr)


