여수국가산업단지에서 배출되는 대기오염물질이 여수시 대기질에 미치는 영향 연구
Abstract
In this study, the effects of air pollutants (emissions) emitted from the Yeosu National Industrial Complex (YNIC) on Yeosu’s air quality (concentration) were evaluated through a statistical analysis (linear regression analysis). The air pollutant emission (from YNIC) and concentration (in Yeosu) data for the last 10 years (2011~2020) were used. In case of the air pollutant emissions, a total of 127 species of air pollutants have been emitted from 137 business sites in the YNIC. For the air quality data in Yeosu, common (6 species) and hazardous (9 volatile organic compounds (VOCs) and 7 polycyclic aromatic hydrocarbons (PAHs)) air pollutant concentrations measured at five monitoring stations (Seogang-dong, Wollae-dong, Munsu-dong, Yeocheon-dong, and Deokchung-dong) were used. The concentrations of SO2, NO2, PM10, and PM2.5 in the air in Yeosu recorded significant positive correlations with benzene, xylene, formaldehyde, and hydrogen bromide, which were the air pollutants emitted from the YNIC (R2=0.702±0.129 and p-value=0.009±0.009). The concentrations of the VOCs in the air of Yeosu showed relatively high positive correlations and good statistical significances with the five air pollutant emissions from the YNIC (air pollutants emitted from the YNIC (affected VOCs)=tributylamine (benzene), hydrogen sulfide (benzene), ethylbenzene (1,3-butadiene), vinyl chloride (carbontetrachloride), and sulfur (styrene)) (R2=0.783±0.052 and p-value=0.004±0.003). In the case of PAHs, the YNIC emissions of formaldehyde, copper, and hydrogen fluoride had high effects on the concentrations of the all target 7 PAHs (R2=0.763±0.140 and p-value=0.014±0.012). As such, it was confirmed through a statistical analysis that the increase in emissions of specific air pollutants emitted from the YNIC increased the concentrations of the air pollutants in the air around Yeosu. These results of this study can be expected to be used as the basic data to efficiently manage the types and emissions of air pollutants from the YNIC. Furthermore, it can be used as basic policy data for improving air quality in the cities where National Industrial Complexes are located.
Keywords:
Yeosu National Industrial Complex (YNIC), Common air pollutants, Volatile organic compounds (VOCs), Polycyclic aromatic hydrocarbons (PAHs)1. 서 론
대기질은 국민들의 삶의 질을 결정하는 중요한 요소 중 하나이다. 이와 같은 이유로 우리나라는 환경부를 포함한 각종 정부부처에서 대기질을 개선하기 위한 노력을 기울이고 있다. 우리나라는 산업화 이후 심각해진 대기오염문제를 해결하기 위해 1970년대 대기오염물질의 관리 기준을 강화하였으며, 이와 같은 노력으로 산업시설 및 발전소와 다양한 운송수단에서 주로 발생하는 기준 대기오염물질들 (SO2, NO2, O3, CO, PM10, PM2.5)의 농도를 현저하게 줄여왔다. 하지만 여전히 미세먼지와 각종 유해대기오염물질들 (i.e., benzene, benzo[a]pyrene, 1,3-butadiene, styrene, eth-ylbenzene 등)로 인한 국민들의 건강상 피해 문제가 남아있는 실정이다 (Kim et al., 2021; Yeo and Kim, 2019). 미세먼지는 폐질환을 유발할 뿐만 아니라 각종 뇌질환을 일으킨다는 연구가 보고되고 있다 (Roy et al., 2022; Puett et al., 2014). Benzene, benzo[a]pyrene, 1,3-butadiene 등은 국제 암 연구기관 (International Agency for Research on Cancer, IARC)에서 발표한 1급 발암물질에 해당한다 (IARC, 2022). 이처럼 건강에 악영향을 끼칠 수 있는 미세먼지와 유해대기오염물질의 문제를 해결하기 위한 노력이 필요하다.
대기질을 개선하기 위해서는 대기오염물질들의 종류와 농도 평가가 필요하며, 이를 위해 우선적으로 대기오염물질들의 배출원을 파악해야 한다. 일반적으로 국가산업단지는 주변 지역의 대기질에 큰 영향을 줄 수 있는 수준의 대기오염물질들을 배출한다. 정부에서 배출농도를 규제하는 일반 대기오염물질들은 모두 산업단지 내에서 다량으로 배출되며 (화학물질 제조, 화석연료 연소, 폐기물 소각 처리 등), 각 사업장에서 취급하는 화학물질의 종류에 따라서 volatile organic compounds (VOCs)와 polycyclic aromatic hydrocarbons (PAHs) 등의 유해화학물질들도 배출된다 (Marquès et al., 2020; Gaffney and Marley, 2009). 그러므로 대기질 관리를 위해서는 우선적으로 국가산업단지에서 배출하는 대기오염물질에 대한 철저한 관리가 필요하다. 우리나라의 주요 국가산업단지들 (면적 규모가 25,000 km2 이상 대규모 단지 6곳: 울산미포국가산업단지, 반월특수지역국가산업단지, 여수국가산업단지, 광양국가산업단지, 창원국가산업단지, 온산국가산업단지)의 연간 오염물질 평균 배출량은 1,978 ton (2020년 기준)이며, 이 중 대기오염물질의 배출량은 전체 오염물질의 약 99%를 차지한다 (KICOX, 2022; MOE, 2022b, 2022c). 즉, 지역 국가산업단지에서 배출되는 대기오염물질의 관리를 통해 효율적인 대기질의 개선을 기대할 수 있다.
전라남도 여수에 위치한 여수국가산업단지는 우리나라 최대의 석유화학단지이다 (2020년 석유화학제품 취급량: 70,524 kt). 여수국가산업단지의 부지경계선으로부터 1~3 km 이내에 주거지역 및 상업시설이 위치하고 있다. 그래서 풍향 및 풍속을 포함한 다양한 환경 조건에 따라 산업단지에서 배출하는 대기오염물질들이 주거 및 상업지역으로 이동할 수 있다 (Boré et al., 2022; Jung et al., 2018; Yang et al., 2018). 그러나 산업단지에서 배출되는 대기오염물질들이 산업단지 주변의 주거 및 상업지역의 대기질에 어떠한 영향을 주는지 체계적으로 연구한 사례를 찾아보기 어렵다.
본 연구에서는 여수국가산업단지에 위치한 사업장에서 배출되는 사업장 대기오염물질들이 여수시 대기질에 미치는 영향을 연구하였다. 최근 10년간의 여수시 대기질 측정 자료와 여수국가산업단지에서 배출한 사업장 대기오염물질들의 배출량 자료 간의 상관분석을 실시하여 여수시의 대기질을 결정하는 주요 사업장 대기오염물질들 (여수국가산업단지에서 배출)을 확인해 보았다.
2. 연구 재료 및 연구 방법
2. 1 대기오염물질 배출원: 여수국가산업단지
여수국가산업단지는 우리나라 전라남도 남쪽 해안지역인 여수시에 위치해 있다 (그림 1). 여수국가산업단지 내 위치한 사업장 중 대기오염물질 배출량 자료가 공개된 사업장은 137곳에 해당하며, 본 연구기간 동안 이들 사업장에서 배출한 대기오염물질의 종류는 127종에 달한다 (표 1) (MOE, 2022a). 여수국가산업단지의 총면적은 32,550 km2이며 공장과 물류 시설을 포함한 산업시설들이 70% 이상을 차지하고 있다 (MOLEG, 2021). 여수국가산업단지 부지 경계면을 기준으로 약 10 km 떨어진 지역에 주거 및 상업시설이 밀집되어 있다. 이와 같은 산업단지 밀집 주거지역의 인구는 여수시 인구의 약 90%인 25만여 명이다 (Yeosu City Hall, 2021).
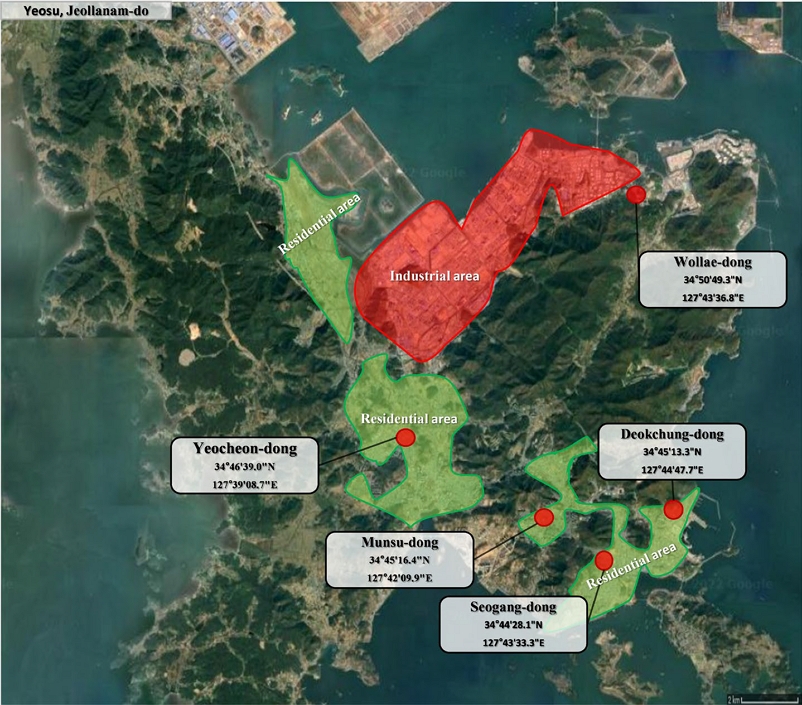
Geographical location of the air quality monitoring stations in Yeosu, Jeollanam-do, Republic of Korea.
2. 2 분석대상 대기오염물질: 여수시 대기오염물질 측정소 자료
여수시 대기질에 영향을 주는 분석대상 대기오염물질은 배출허용기준이 존재하는 일반 대기오염물질과 유해대기오염물질로 선정하였다. 일반 대기오염물질은 총 6종을 선정하였다 (SO2, NO2, O3, CO, PM10, PM2.5). 유해대기오염물질은 9종 VOCs (benzene, toluene, ethylbenzene, m,p-xylene, styrene, o-xylene, chloroform, carbontetrachloride, 1,3-butadiene)와 7종 PAHs (benzo[a]anthracene, chrysene, benzo[b]fluoranthene, benzo[k]fluoranthene, dibenzo[a,h]anthracene, indeno[1,2,3-cd]pyrene, benzo[a]pyrene)을 선정하였다. 분석대상 대기오염물질들 중 2018년도 이후에 측정을 시작하여 연간 농도 자료가 3개 이하인 유해대기오염물질들은 본 연구대상 대기오염물질에서 제외하였다.
분석대상 대기오염물질들의 농도 자료는 여수시 내 위치한 5곳 (서강동, 월내동, 문수동, 여천동, 덕충동)의 최근 10년간 (2011~2020) 대기질 측정소 자료를 활용하였다 (MOE, 2021). 월내동 측정소는 산업단지 중심부를 기준으로 동쪽 부지 경계면 인근에 위치하고 있다. 여천동 측정소는 산업단지와 가장 가까운 주거 및 상업시설 밀집지역이며, 산업단지 부지 경계면을 기준으로 남쪽 3 km 반경에 위치하고 있다. 서강동, 문수동, 덕충동 측정소는 산업단지의 중심부에서 남동쪽으로 7~9 km 떨어진 지점에 위치해 있다. 여수국가산업단지, 대기질 측정소 5곳, 주거 및 상업지역의 위치를 그림 1에 제시하였다.
2. 3 자료조사 및 방법
본 연구에서는 여수국가산업단지 내 사업장으로부터 배출되는 사업장 대기오염물질들의 배출량과 여수시 대기오염물질들의 농도를 선형회귀분석 (linear regression analysis)을 통해 이들의 상관성을 평가하였다. 이를 통해, 사업장 대기오염물질의 종류와 배출량에 따라 특이적으로 영향을 받는 여수시 대기오염물질의 종류와 농도를 확인하였다.
사업장 대기오염물질들의 배출량 자료는 환경부 화학물질안전원에서 공개한 자료를 사용하였다 (MOE, 2022a). 2011년부터 2020년까지 10년간 사업장 대기오염물질의 종류 및 배출량 자료를 활용하였다. 연구기간 동안 사업장 대기오염물질의 배출량 자료가 3개 이하인 자료는 본 연구분석 (회귀분석)에서 제외하였다.
여수시 대기 중에 존재하는 다양한 대기오염물질 농도 자료 (일반 및 유해대기오염물질)는 환경부 국립환경과학원에서 연간 발행하는 대기환경연보를 통해 확보하였다 (MOE, 2021). 일반 대기오염물질은 5곳 (서강동, 월내동, 문수동, 여천동, 덕충동)의 측정소 자료를 활용하였다. PM2.5를 제외한 5종 일반 대기오염물질들 (SO2, NO2, O3, CO, PM10)은 2011년부터 2020년까지 10년간의 자료를 활용하였으며, PM2.5는 측정을 시작한 해의 2015년부터 2020년까지 6년간의 자료를 활용하였다. 유해대기오염물질들 (9종 VOCs, 7종 PAHs)은 2013년부터 2020년까지 유해대기오염물질 측정망이 위치한 여천동 측정소의 측정 자료를 활용하였다.
분석대상 대기오염물질들은 환경부에서 지정한 측정방법을 통해 농도를 산정하였다 (SO2: 자외선형광법, NO2: 화학발광법, O3: 자외선광도법, CO: 비분산적외선법, 미세먼지 (PM10, PM2.5): 베타선 흡수법). 유해대기오염물질 중 VOCs의 농도 측정은 데이터의 연속성과 재현성 확보를 위해 수동측정방법과 자동연속측정방법을 모두 활용하였다. 수동측정방법은 월 1회를 주기로 24시간 채취를 하였으며, 최종적으로 고체흡착열탈착분석법을 통해 분석하였다. PAHs는 수동측정방법으로 농도를 측정하였으며, 월 1회를 주기로 24시간 채취를 통해 High-Performance Liquid Chromatography (HPLC)나 Gas Chromatography-Mass Spec-trometry Detector (GC-MSD)를 이용하여 정량분석하였다. 대기오염측정망의 측정기기는 환경분야 시험 검사 등에 관한 법률, 시행령, 시행규칙에 의거하여 정도관리를 진행하였다. 분석대상 대기오염물질들의 자세한 측정방법과 정도관리 결과는 환경부에서 제공하는 대기오염측정망 설치 및 운영지침에 자세하게 제시되어 있다 (MOE, 2011).
3. 결과 및 토론
3. 1 여수시 대기질의 변화
최근 10년간 (2011~2020) 여수시 일반 대기오염물질 농도 변화를 측정소별로 구분하여 그림 2에 제시하였다. SO2, NO2, PM10, PM2.5의 농도는 연구기간 동안 지속적으로 감소하였으며, O3와 CO는 통계적으로 유의미한 농도 변화가 없었다. 연구기간 동안 일반 대기오염물질들의 농도 변화는 측정소에 따라 뚜렷한 차이를 보이지 않았다. 다만, 특정 측정소의 일반 대기오염물질의 농도가 상대적으로 높게 측정되는 특징 이 있다 (SO2: 11.3±2.00 ppb (월내동) vs. 5.46±1.29 ppb (그 외 4개 측정소), NO2: 22.6±4.88 ppb (월내동) vs. 16.46±2.40 ppb (그 외 4개 측정소), PM2.5: 28.7±3.27 μg m-3 (문수동) vs. 18.0±3.05 μg m-3 (그 외 4개 측정소)).
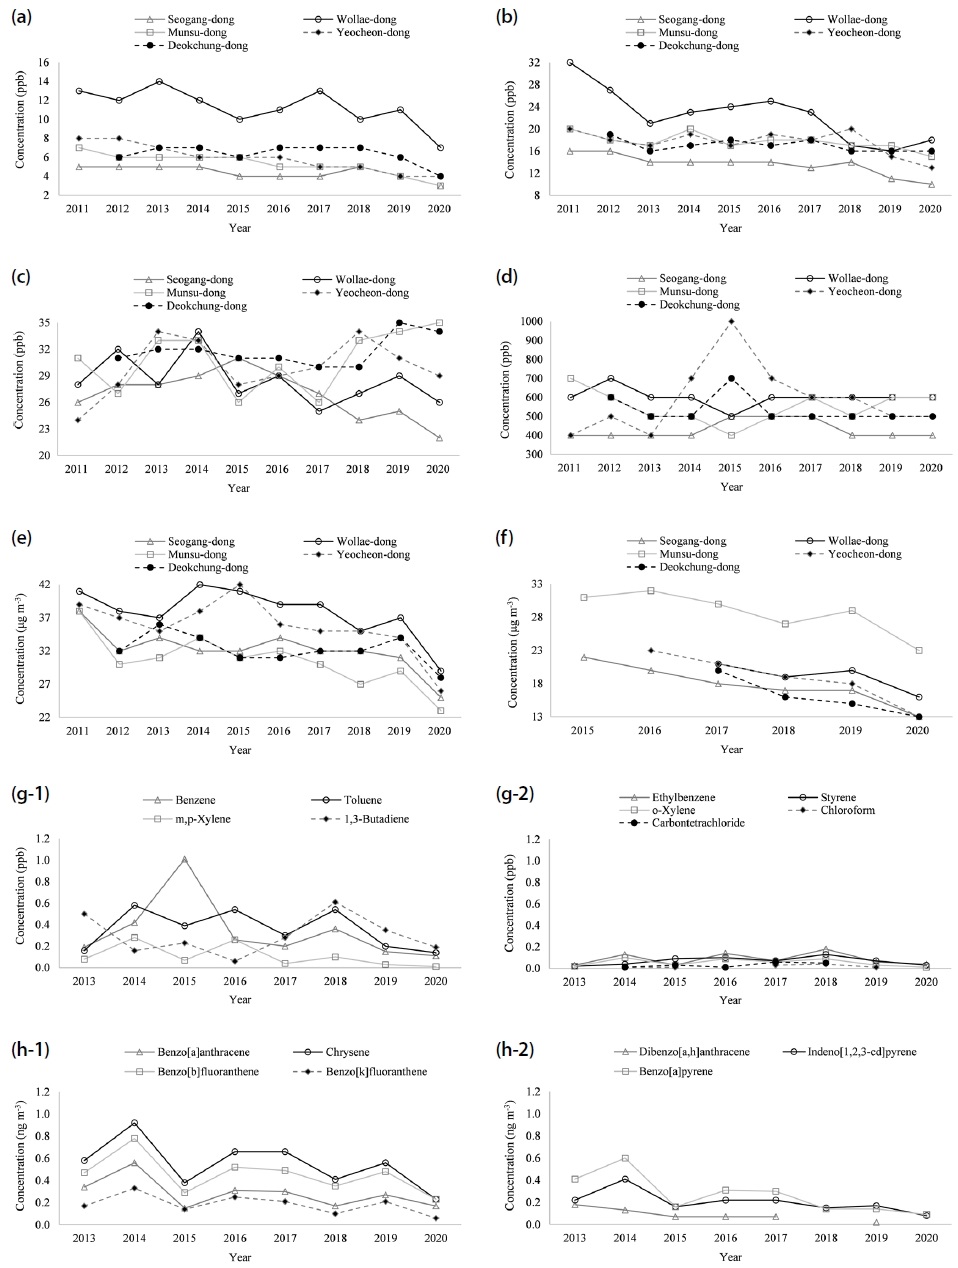
Concentrations of air pollutants in Yeosu (2011~2020). (a) SO2, (b) NO2, (c) O3, (d) CO, (e) PM10, (f) PM2.5, (g) 9 VOCs, and (h) 7 PAHs.
SO2는 2011년도에 평균 8.25±3.40 ppb에서 2020년도에 4.20±1.64 ppb로 농도가 49.1% 감소하였다. 2020년 기준 산업단지와 밀접한 위치의 월내동의 SO2 농도는 7 ppb로 다른 지역 (3.50±0.58 ppb)에 비해 상대적으로 높은 농도를 기록하였다. 또한, 최근 10년 간 SO2의 평균 농도는 월내동이 11.3±2.00 ppb로 다 른 지역 (5.46±1.29 ppb)에 비해 2배 이상 높은 농도를 기록하였다. NO2의 측정소 평균 농도는 2011년 22.0±6.93 ppb에서 2020년 14.4±3.05 ppb로 34.5% 감소하였다. 산업단지 내 월내동의 2011년 NO2 농도는 32 ppb로 다른 지역 (18.7±2.31 ppb)에 비해 71.1% 높았지만, 이후 지속적으로 감소하여 2020년도에는 18 ppb를 기록하였다. 이는 2020년도 다른 지역의 평균 NO2 농도 (13.5±2.65 ppb)보다 33.3% 높은 수치에 해당한다.
O3와 CO는 2011년도에서 2020년도 연구기간 동안 뚜렷한 농도 변화가 없었다. O3와 CO는 2011년도에 농도가 각각 27.3±2.99 ppb와 525±150 ppb를 기록하였으며, 2020년도에는 각각 29.2±5.45 ppb와 520±83.7 ppb로 유의미한 농도 차이가 없었다. 단, 여천동의 경우, 2014년부터 2016년까지 평균 CO의 농도가 800±173 ppb로 다른 측정소 (4개 측정소 평균 CO 농도=517±83.5 ppb)에 비해 54.8% 높게 나타났다. PM10과 PM2.5는 2011년 대비 (PM2.5는 2015년 대비) 2020년도에 농도 감소가 각각 32.8%와 41.1%로 크게 나타났다 (PM10: 39.0±1.41 μg m-3 (2011), 26.2±2.39 μg m-3 (2020), PM2.5: 26.5±6.36 μg m-3 (2015), 15.6±4.34 μg m-3 (2020)). PM10은 월내동 측정소에서 연구기간 동안 가장 높은 농도인 37.8±3.77 μg m-3을 기록하였다 (4개 측정소 평균 PM10 농도=32.7±2.45 μg m-3). PM2.5는 문수동 측정소에서 매년 다른 지역의 측정소보다 평균 54.1±10.3% 높은 농도 값을 기록하였다.
2020년도 여수시 일반 대기오염물질들의 농도는 국내 대기환경기준을 초과하지 않았다 (MOLEG, 2022a). 하지만 여수시 PM의 농도는 WHO global air quality guidelines 권고기준 농도 (15 μg m-3 (PM10), 5 μg m-3 (PM2.5))을 각각 74.7%와 160% 초과하였다 (WHO, 2021).
여수시 여천동 측정소에서 측정한 분석대상 유해대기오염물질 (9종 VOCs와 7종 PAHs)의 농도는 연구기간 동안 (2013~2020) 유의미한 농도 변화가 없거나 감소하는 경향을 보였다. 유해대기오염물질 (9종의 VOCs 와 7종의 PAHs)의 연도별 농도 변화는 그림 2에 제시하였다.
9종의 VOCs은 2013년 0.14±0.17 ppb에서 2020년 0.08±0.07 ppb로 42.9%가 감소하였지만, 이는 농도 비중을 많이 차지하고 있는 성분의 큰 감소 폭으로 인해 나타난 것으로 보인다 (benzene은 2013년 0.19 ppb에서 2020년 0.11 ppb로 42.1% 감소, 1,3-butadiene은 2013년 0.50 ppb에서 2020년 0.19 ppb로 62.0% 감소). Benzene과 1,3-butadiene을 제외한 나머지 물질들의 농도 변화는 2013년 0.06±0.06 ppb에서 2020년 0.05±0.05 ppb로 유의미한 변화는 보이지 않았다. 또한, 기존 2013년에 비해 5배 이상 농도가 증가된 경우도 benzene을 제외하고는 나타나지 않았으며, 2015년 benzene의 급격한 농도 증가도 일시적인 현상으로 그 다음 해인 2016년 0.26 ppb로 감소하였으며, 2020년에는 0.11 ppb로 2013년 대비 42.1% 감소한 것으로 관찰되었다. Benzene의 배출허용농도가 10 ppm인 것을 고려하면, 여수시의 VOCs 농도 수준이 상대적으로 낮다는 것을 알 수 있다 (MOLEG, 2022b). 그럼에도 불구하고 benzene은 심장질환을 일으키는 1급 발암물질이고, 이 외 다른 종류의 VOCs도 유해물질로 알려져 있기 때문에 철저한 VOCs의 농도 관리가 요구된다 (D’Andrea and Reddy, 2018; Abplanalp et al., 2017).
PAHs의 평균 농도는 2013년도에 0.34±0.16 ng m-3에서 2020년에는 0.14±0.08 ng m-3으로 57.7% 감소하였다 (그림 2). 연구기간 동안 PAHs 농도 변화는 대부분 매우 유사하게 나타났다 (R2=0.365±0.145). 결과적으로 PAHs는 형성과 거동에 서로 영향을 준다고 추론할 수 있다. 대기 중에 존재하는 PAHs는 광화학반응을 통해 독성물질이 생성되며 지속적인 인체노출 시 폐암 및 방광암을 포함한 다양한 질환을 야기할 수 있다 (Lee and Lane, 2010; Reisen and Arey, 2005; Boffetta et al., 1997). 이와 같은 이유로 PAHs의 농도를 더욱 줄이기 위한 노력이 필요하다.
3. 2 여수국가산업단지 내 사업장의 대기오염물질 배출 특성
여수국가산업단지 내 사업장에서 최근 10년간 (2011~2020) 대기 중으로 배출한 대기오염물질의 총 누적량은 10.9 kt이며, 연평균 배출량은 1.09±0.180 kt yr-1이다. 연평균 배출량은 2011년 0.947 kt yr-1에서 2020년 1.50 kt yr-1으로 증가하였다. 여수국가산업단지에서 배출하는 대기오염물질의 연도별 총 배출량 변화를 그림 3에 제시하였다.
여수국가산업단지 내 사업장에서는 매년 100에서 111종의 대기오염물질들을 배출하고 있으며, 이 중 20종 (vinyl chloride (7.71%), propylene (6.92%), n-hexane (6.80%), ethylene (6.72%), ammonia (6.34%), butane (4.99%), nitric acid (4.31%), naphtha (4.12%), toluene (3.74%), xylene (3.57%), benzene (3.55%), acrylonitrile (3.38%), styrene (3.37%), cyclohexane (3.35%), hydrogen chloride (3.31%), sulfur (3.27%), 2-butene (2.83%), methyl alcohol (2.72%), 1-butene (2.70%), methyl tertbutyl ether (2.60%))의 대기오염물질들이 전체 배출량의 86.3%를 차지한다. 사업장 대기오염물질들의 연간 배출량은 연구기간 동안 뚜렷한 변화가 없었다. 단, 5종 사업장 대기오염물질들 (vinyl chloride, ammonia, butane, 1-butene, and 2-butene)은 연도별 배출량의 변화가 다르게 나타났다. Vinyl chloride은 2017~2018년도에 평균 배출량이 238±80.9 ton yr-1으로 10년간 (2011~2020) 누적 배출량인 842 ton yr-1의 56.6%를 차지하였다. Ammonia의 경우, 연구기간 중 2015년과 2016년에 가장 많은 양이 대기 중으로 배출되었다. 2015년과 2016년의 사업장 ammonia 연간 배출량은 평균 131±13.2 ton yr-1으로 다른 연도 배출량 평균인 53.6±13.0 ton yr-1에 비해 244% 높았다. Butane 계열 (butane, 1-butene, 2-butene)의 대기오염물질들은 2011년도 대비 2020년에 배출량이 급격하게 증가하였다. Butane은 46.75 ton yr-1 (2019)에서 224 ton yr-1 (2020)으로 배출량이 약 380% 상승하였으며, 1-butene은 11.2 ton yr-1에서 142 ton yr-1으로 약 1,168% 상승하였다. 그리고 2-butene의 경우, 2019년 6.30 ton yr-1에서 285 ton yr-1으로 배출량이 4,423% 상승하였다. 이와 같이 5종 대기오염물질들 (vinyl chloride, ammonia, butane, 1-butene, and 2-butene)의 연간 배출량의 급격한 변화를 확인하였다. 사업장 주요 대기오염물질 20종의 연도별 배출량은 그림 4에 제시하였다.
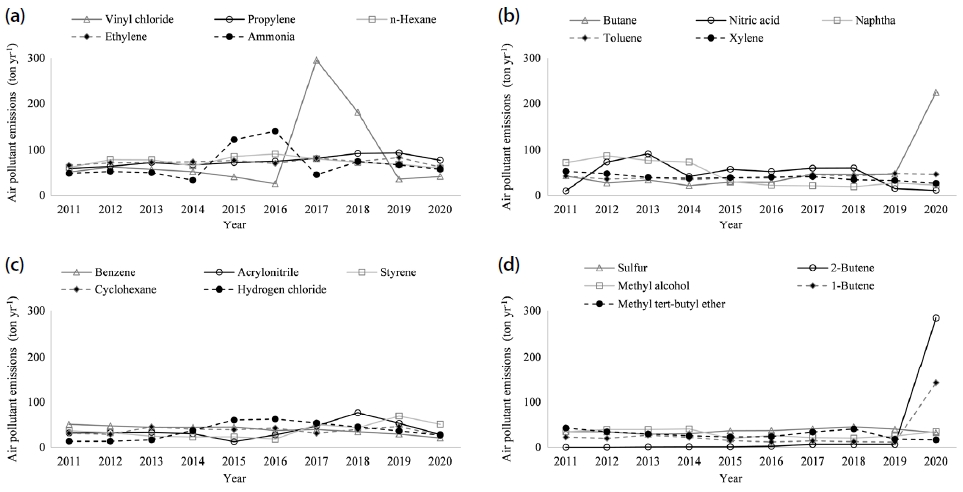
Emissions of air pollutants from YNIC (2011~2020). (a) vinyl chloride, propylene, n-hexane, ethylene, and ammonia, (b) butane, nitric acid, naphtha, toluene, and xylene, (c) benzene, acrylonitrile, styrene, cyclohexane, and hydrogen chloride, and (d) sulfur, 2-butene, methyl alcohol, 1-butene, and methyl tert-butyl ether.
3. 3 여수국가산업단지 사업장 대기오염물질들의 여수시 대기질 영향 평가
본 연구에서는 여수국가산업단지 상업장 대기오염물질들이 여수시 대기질에 끼치는 영향을 평가해 보았다. 이를 위해, 최근 10년간 (2011~2020) 사업장에서 배출된 대기오염물질의 종류 및 배출량 자료를 여수시 측정소에서 확보한 대기오염물질의 종류 및 농도 자료와 일차회귀분석 (상관분석)을 실시하였다.
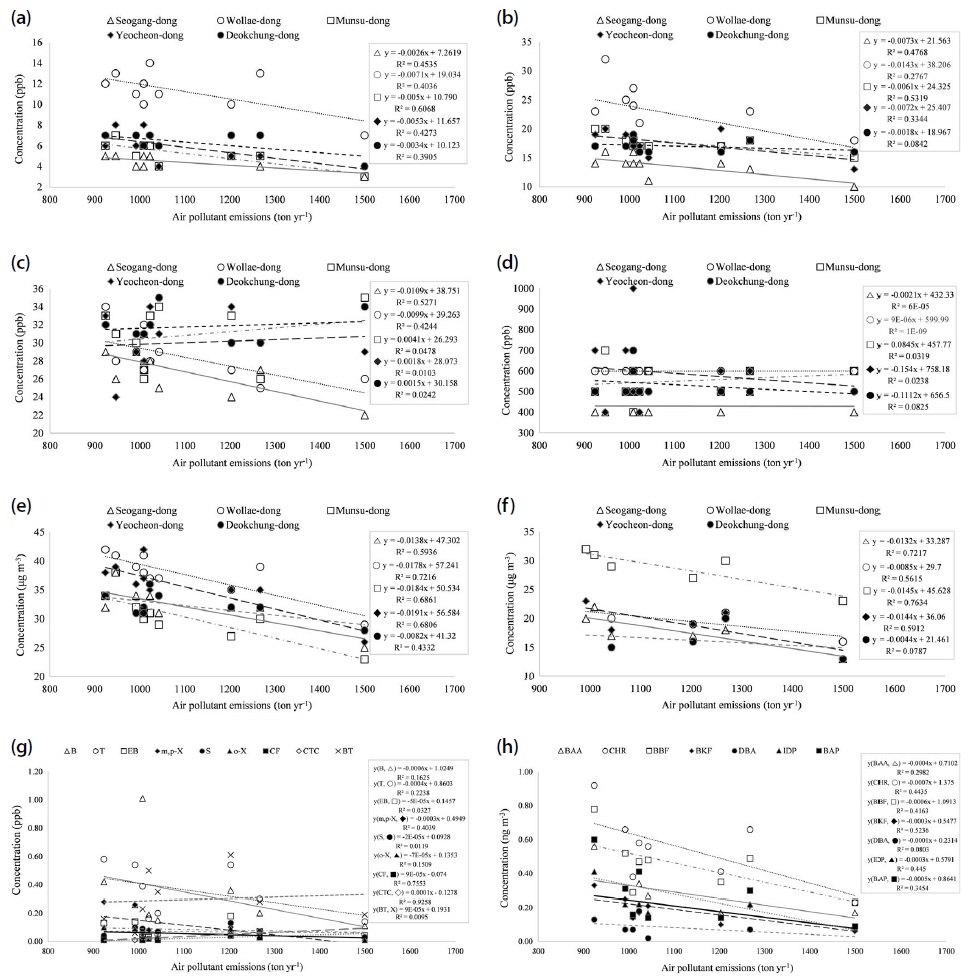
사업장 대기오염물질의 총 배출량과 여수시 대기오염물질의 농도를 일차회귀분석을 통해 상관성 평가를 수행하였다 (그림 5). 사업장 대기오염물질 총 배출량이 증가함에 따라 여수시 일반 대기오염물질들의 농도는 감소하는 경향을 보였으나, 전반적으로 R2 값이 0.4 이하로 높은 상관성을 보이지 않았다 (slope: -0.013±0.0197, R2=0.366±0.156). PM10과 PM2.5는 사업장 대기오염물질 총 배출량과 상관성이 상대적으로 높게 나타났다 (R2=0.583±0.195). 이는 butane 계열의 사업장 대기오염물질 3종의 배출량이 2020년도에 급격하게 증가하기 때문이다. Butane 계열 3종 사업장 대기오염물질들의 2020년도 배출량을 제외하면, PM10과 PM2.5를 포함하여 대기 중 일반 대기오염물질 농도 간 상관성은 현저하게 떨어진다 (slope: -0.0130±0.0197, R2=0.129±0.122). VOCs는 chloroform, carbontetrachloride, 1,3-butadiene을 제외한 6종 VOCs의 농도가 사업장 대기오염물질의 총 배출량이 증가함에 따라 감소하는 경향을 나타냈다. 그러나 VOCs는 전반적으로 여수시 사업장 대기오염물질의 총 배출량 간 상관성이 낮게 나타났다 (R2=0.329±0.337). PAHs 농도는 사업장 대기오염물질의 총 배출량과 상관성이 평균 0.365±0.145의 R2 값을 기록하면서 VOCs와 마찬가지로 유의미한 상관성을 보이지 않았다. 2020년도 butane 계열의 사업장 대기오염물질의 배출량을 제외하면, VOCs와 PAHs의 농도와 사업장 대기오염물질의 총 배출량 간의 R2 값은 더욱 현저하게 떨어진다.
사업장 대기오염물질들의 개별 배출량과 여수시 대기오염물질들의 농도 간 회귀분석을 수행한 결과 (양의 상관성)를 그림 6에 제시하였다. 그림 6을 보면, 여수시 대기오염물질 농도와 상관성이 높은 사업장 대기오염물질들은 여수시 대기오염물질의 종류에 따라 다르게 나타났다. 이와 같은 상관성 분석 결과에 대한 신뢰성을 확보하기 위해서는 통계적 유의성을 평가하는 것이 필요하다. 이와 같은 이유로 그림 6에 제시한 결과들 중 여수시 대기오염물질의 농도와 상관성이 비교적 높게 나타난 사업장 대기오염물질들 (여수시 대기오염물질과의 R2 값이 0.5 이상일 경우)을 중심으로 통계적 유의성 평가를 실시하고 이를 표 2에 제시하였다. 추가적으로 사업장 대기오염물질의 배출량이 많았던 10종 물질들 (vinyl chloride, propylene, n-hexane, ethylene, ammonia, butane, nitric acid, naphtha, toluene, xylene)에 대해서도 여수시 대기오염물질 농도와의 상관분석 및 통계적 유의성 분석을 실시한 후 표 2에 제시하였다. 단, 여수시 대기오염물질의 농도와 통계적 유의성을 보이지 않은 4종 사업장 대기오염물질들 (propylene, ammonia, butane, toluene)은 최종적으로 표 2에 제시하지 않았다.
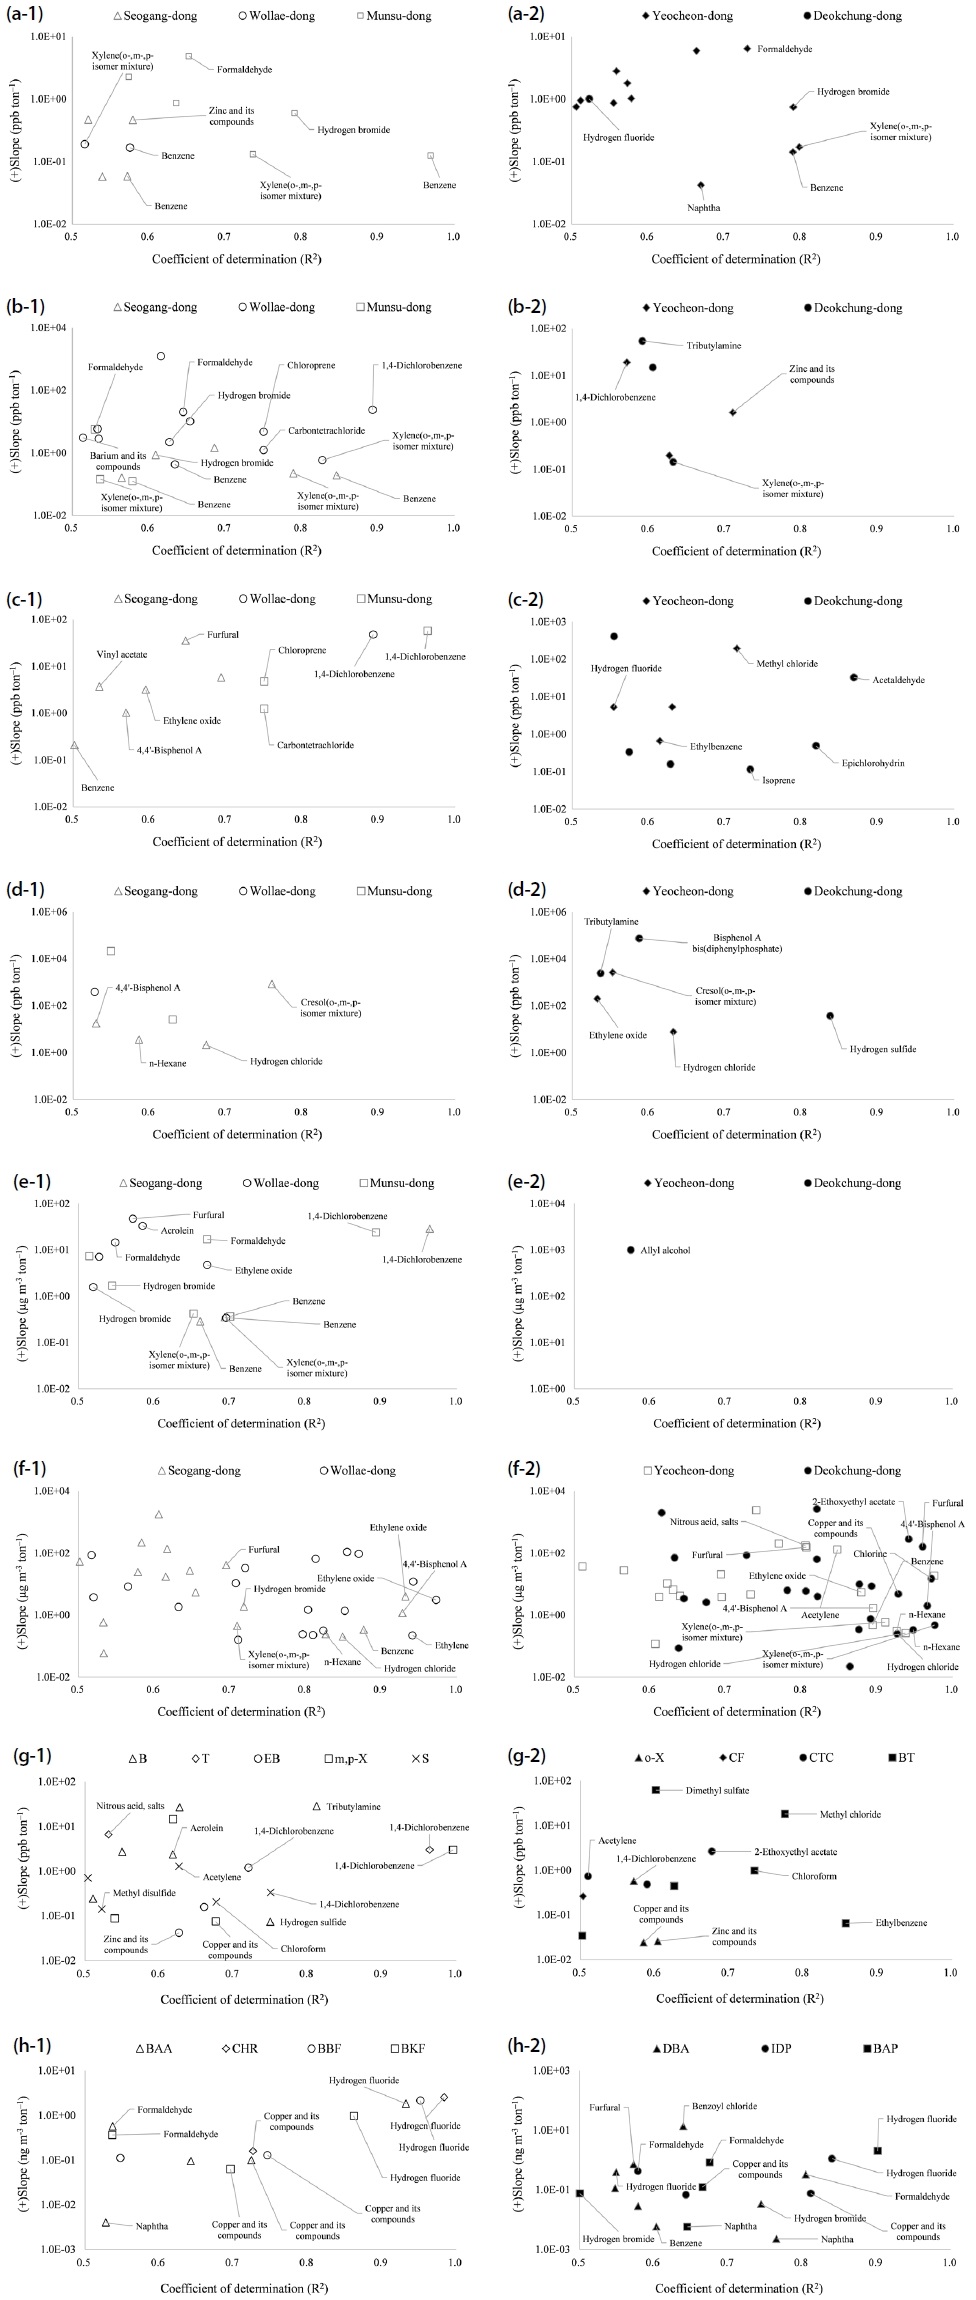
Results of the regression analysis between air pollution emissions from YNIC and air pollutant concentrations around Yeosu (slope and R2 values). (a) SO2, (b) NO2, (c) O3, (d) CO, (e) PM10, (f) PM2.5, (g) 9 VOCs, and (h) 7 PAHs.

Results of the correlation analysis between major air pollutant emissions (43 species) from YNIC and the air pollutant concentrations (22 species) around Yeosu (coefficient of determinationa (R2) and their p-values).
SO2는 사업장 대기오염물질들 중 benzene, xylene, formaldehyde, furfural, hydrogen bromide와 여수시 측정소 2곳 이상에서 R2 값이 모두 0.5 이상을 기록하였으며, 통계적으로도 p-value가 0.05 이하로 유의하였다. 이와 같은 5종 사업장 대기오염물질들은 여천동과 문수동에서 평균 R2 값이 0.747±0.116으로 매우 높은 상관성을 기록하였다. 즉, 여수국가산업단지의 남쪽 및 남동쪽에 위치한 여천동과 문수동의 SO2 농도에 영향을 미치는 성분으로 판단된다. NO2 또한 SO2의 농도에 상대적으로 영향을 크게 준 사업장 대기오염물질 benzene, xylene, formaldehyde, hydrogen bromide가 여수시 대기 중 NO2 농도와 높은 상관성을 보였다 (R2=0.659±0.111). 다만, SO2는 여천동과 문수동에서 상관성이 높게 나온 반면에 NO2는 주로 월내동과 서강동에 상관성이 높게 나타난 특징을 보였다. O3와 CO는 SO2 및 NO2와 다르게 여수시 측정소에 따라 농도에 영향을 주는 사업장 대기오염물질들이 다르게 나타났다. O3는 isoprene, epichlorohydrin, acetaldehyde가 덕충동에서 R2 값이 평균 0.807±0.069 (p-values<0.01)로 높게 나타난 것이 특징이다. CO는 hydrogen chloride가 서강동과 여천동에서 R2 값이 각각 0.674와 0.632로 비교적 높게 나타났으며 p-value도 모두 0.01 이하로 나타났다. 즉, 여수시 대기 중 O3과 CO의 농도는 여수국가산업단지의 대기오염물질 배출량과 상관성 높은 물질이 상대적으로 적었으며, 측정소별 경향을 확인하기 어려웠다. PM10과 PM2.5는 약 10종 이상의 사업장 대기오염물질들이 다수의 여수시 측정소에서 상대적으로 높은 0.5 이상의 R2 값을 기록하였다. PM10과 PM2.5 농도의 R2 값이 0.5를 기록하면서 통계적 유의성을 갖는 (p-value<0.05) 사업장 대기오염물질들은 각각 8종과 14종이다. 특히, 사업장 대기오염물질들 중 benzene, xylene, furfural, hydrogen bromide, 4,4′-bisphenol A, ethylene oxide는 PM10과 PM2.5 모두에서 R2 값이 0.5 이상이고 p-value는 0.05 이하를 기록하였다. 결과적으로 기체상 오염물질들 (SO2, NO2, O3, and CO)과 비교하여 입자상 오염물질인 미세먼지의 농도에 영향을 주는 사업장 대기오염물질들이 다수 존재하는 것을 확인하였다.
VOCs 농도에 영향을 주는 사업장 대기오염물질들은 16종이며 (R2>0.5 and p-value<0.05), 이들은 9종 VOCs 농도에 전반적으로 영향을 주었다. 위에 언급한 16종 사업장 대기오염물질들 중 여수시 VOCs 농도와 상관성이 통계적으로 매우 유의미한 수준 (p-values<0.01)을 기록한 성분은 tributylamine (benzene), hydrogen sulfide (benzene), ethylbenzene (1,3-butadiene), vinyl chloride (carbontetrachloride), sulfur (styrene)에 해당한다 (R2=0.783±0.052). 사업장 배출 VOCs와 여수시 대기 중 VOCs가 같은 물질이어도 배출량과 농도의 상관성이 낮게 기록된 것으로 보아, 사업장에서 배출되는 VOCs가 직접적으로 여수시 대기 중 VOCs 농도에 영향을 주지 않는 것으로 판단된다. 또한, 여수시 대기 중 VOCs의 농도에 영향을 주는 사업장 대기오염물질들의 종류가 aromatic, amine, sulfide, chloride로 다양한 것으로 보아, 이들이 사업장에서 배출되는 공정에 의한 간접영향이 클 것으로 예상된다.
PAHs의 경우, 사업장 대기오염물질들 중 formaldehyde, copper, hydrogen fluoride가 각각 5종, 6종, 6종의 PAHs 농도와 통계적으로 유의미한 상관성을 기록하였다 (R2=0.763±0.140). Copper와 hydrogen fluoride는 공통적으로 benzo[a]anthracene, chrysene, benzo[b]fluoranthene 성분과 p-value가 0.01 이하로 매우 높은 통계적 유의성을 기록하였으며, R2 값 또한 평균 0.844±0.124로 매우 높게 나타났다. 이 외 naphtha 성분이 PAHs 중 benzo[a]anthracene, dibenzo[a,h]anthracene, benzo[a]pyrene 농도와 상관성이 높게 나타난 것이 특징이다. PAHs의 대표적인 발암물질인 benzo[a]pyrene의 농도는 앞서 언급한 formaldehyde, copper, hydrogen fluoride, naphtha 배출량과 통계적으로 유의미한 상관성을 기록하였다 (R2=0.722±0.120). PAHs는 VOCs와 다르게 이들의 농도에 영향을 주는 사업장 대기오염물질이 상대적으로 적게 나타났다. 그러나 PAHs의 농도에 영향을 주는 소수의 사업장 대기오염물질은 6종 이상의 PAHs의 농도에 영향을 주는 특징을 보였다. 즉, 소수의 사업장 대기오염물질들이 다수의 PAHs의 농도에 영향을 주는 것을 통계적으로 확인하였다. PAHs의 농도에 영향을 주는 사업장 대기오염물질인 formaldehyde, copper, hydrogen fluoride는 직접적으로 PAHs의 농도 증가에 기여한다고 보기 어려운 물리화학적 구조를 갖는다. 이에, VOCs와 마찬가지로 사업장에서 이들을 배출하는 공정과 관련한 간접적인 영향이 클 것으로 판단된다.
4. 결 론
본 연구에서는 여수시 국가산업단지에서 배출되는 대기오염물질의 종류 및 배출량이 여수시 대기질에 미치는 영향을 통계분석 (회귀분석)을 통해 확인하였다 (2011~2020년도 자료). 여수시 대기질 자료는 여수시 산업단지를 포함한 거주지 지역을 중심으로 총 5곳의 일반 대기오염물질 (SO2, NO2, O3, CO, PM10, PM2.5)과 1곳의 유해대기오염물질 (9종 VOCs와 7종 PAHs) 농도를 활용하였다.
사업장 대기오염물질의 총 배출량은 여수시 대기 오염물질들의 농도에 유의미한 영향을 주지 않았다. 그러나 사업장 대기오염물질들을 개별 성분별로 평가하였을 때, 이들의 배출량이 여수시 대기오염물질들의 농도와 비교적 높은 양의 상관성을 가지며 통계적으로도 유의미한 물질들을 확인하였다 (R2>0.5 and p-value<0.05). 대표적으로 여수시 대기 중 SO2, NO2, PM10, PM2.5의 농도는 사업장 대기오염물질인 benzene, xylene, formaldehyde, hydrogen fluoride의 배출량과 공통적으로 높은 상관성 및 통계적 유의성을 기록하였다 (R2=0.702±0.129 and p-value=0.009±0.009). VOCs는 다양한 종류의 사업장 대기오염물 질들의 개별 배출량이 소수의 여수시 VOCs 농도에 대해서만 높은 상관성을 보였다. 이에 반해, 여수시 PAHs 농도는 사업장 대기오염물질인 formaldehyde, copper, hydrogen fluoride가 5종 이상의 여수시 PAHs 농도와 높은 상관성 (R2=0.763±0.140)과 더불어 뚜렷한 통계적 유의성 (p-value=0.014±0.012)을 기록하였다.
본 연구 결과 여수시 국가산업단지에서 배출된 대기오염물질들이 직접적으로 여수시의 대기오염물질의 농도 증가에 기여하는 것을 통계적으로 확인할 수 없었다. 그럼에도 불구하고 여수시 대기오염물질의 농도에 통계적으로 상관성이 높은 사업장 대기오염물질들을 다수 확인하였다. 즉, 사업장 대기오염물질들이 형성되는 간접적인 요인들이 여수시 대기질에 영향을 주는 것으로 예상된다.
Acknowledgments
본 연구는 전북대학교 2022학년도 교육, 연구 및 학생지도비용 (학술트랙)을 지원받아 수행하였습니다.
References
-
Abplanalp, W., DeJarnett, N., Riggs, D.W., Conklin, D.J., McCracken, J.P., Srivastava, S., Xie, Z., Rai, S., Bhatnagar, A., O’Toole, T.E. (2017) Benzene exposure is associated with cardiovascular disease risk, PLoS One, 12(9), e0183602.
[https://doi.org/10.1371/journal.pone.0183602]

-
Boffetta, P., Jourenkova, N., Gustavsson, P. (1997) Cancer risk from occupational and environmental exposure to polycyclic aromatic hydrocarbons, Cancer Causes & Control, 8(3), 444-472.
[https://doi.org/10.1023/A:1018465507029]

-
Boré, A., Cui, J., Huang, Z., Huang, Q., Fellner, J., Ma, W. (2022) Monitored air pollutants from waste-to-energy facilities in China: Human health risk, and buffer distance assessment, Atmospheric Pollution Research, 13(7), 101484.
[https://doi.org/10.1016/j.apr.2022.101484]

-
D’Andrea, M.A., Reddy, G.K. (2018) Health risks associated with benzene exposure in children: a systematic review, Global pediatric health, 5, 2333794X18789275.
[https://doi.org/10.1177/2333794X18789275]

-
Gaffney, J.S., Marley, N.A. (2009) The impacts of combustion emissions on air quality and climate - From coal to biofuels and beyond, Atmospheric Environment, 43(1), 23-36.
[https://doi.org/10.1016/j.atmosenv.2008.09.016]

- International Agency for Research on Cancer (IARC) (2022) List of Classifications by cancer sites with sufficient or limited evidence in humans, Volumes 1 to 132. https://monographs.iarc.who.int/list-of-classifications, , (accessed on Sep 12, 2022).
- Jung, J.-H., Lee, K., Lim, H.-S., Shon, B.-H. (2018) A Study on the Distribution Characteristics of VOCs in Steel Industrial Complex and Surrounding Area, International Journal of Emerging Technology and Advanced Engineering, 8(8), 228-234.
-
Kim, M.-J., Baek, K.-M., Heo, J.-B., Cheong, J.-P., Baek, S.-O. (2021) Concentrations, health risks, and sources of hazardous air pollutants in Seoul-Incheon, a megacity area in Korea, Air Quality, Atmosphere & Health, 14(6), 873-893.
[https://doi.org/10.1007/s11869-021-00986-z]

- Korea Industrial Complex Corporation (KICOX) (2022) Current status of industrial complexes nationwide in the first quarter of 2022, (accessed on Sep 13, 2022).
-
Lee, J., Lane, D.A. (2010) Formation of oxidized products from the reaction of gaseous phenanthrene with the OH radical in a reaction chamber, Atmospheric Environment, 44(20), 2469-2477.
[https://doi.org/10.1016/j.atmosenv.2010.03.008]

-
Marquès, M., Domingo, J.L., Nadal, M., Schuhmacher, M. (2020) Health risks for the population living near petrochemical industrial complexes. 2. Adverse health outcomes other than cancer, Science of The Total Environment, 730, 139122.
[https://doi.org/10.1016/j.scitotenv.2020.139122]

- Ministry of Environment (MOE) (2011) Guidelines for installation and operation of air pollution monitoring network.
- Ministry of Environment (MOE) (2021) Annual report of air quality in Korea, 2020, (accessed on Sep 12, 2022).
- Ministry of Environment (MOE) (2022a) Pollutant release and transfer register. https://icis.me.go.kr/prtr/prtrInfo/unitySearch.do, , (accessed on Sep 12, 2022).
- Ministry of Environment (MOE) (2022b) Pollutant Release and Transfer Register Report for 2020, (accessed on Sep 12, 2022).
- Ministry of Environment (MOE) (2022c) Chemical emissions by industrial complex. https://stat.me.go.kr/portal/stat/easyStatPage/DT_106N_13_0100017.do, , (accessed on Jan 25, 2023).
- Ministry of Government Legislation (MOLEG) (2021) Basic Plan for Management of National Industrial Complex (Yeosu National Industrial Complex), (accessed on Jan 25, 2023).
- Ministry of Government Legislation (MOLEG) (2022a) Enforcement Decree of the Framework Act on Environmental Policy, (accessed on Sep 19, 2022).
- Ministry of Government Legislation (MOLEG) (2022b) Enforcement Rules of the Air Quality Conservation, (accessed on Sep 19, 2022).
-
Puett, R.C., Hart, J.E., Yanosky, J.D., Spiegelman, D., Wang, M., Fisher, J.A., Hong, B., Laden, F. (2014) Particulate matter air pollution exposure, distance to road, and incident lung cancer in the nurses’ health study cohort, Environmental Health Perspectives, 122(9), 926-932.
[https://doi.org/10.1289/ehp.1307490]

-
Reisen, F., Arey, J. (2005) Atmospheric reactions influence seasonal PAH and nitro-PAH concentrations in the Los Angeles basin, Environmental Science & Technology, 39(1), 64-73.
[https://doi.org/10.1021/es035454l]

-
Roy, D., Lyou, E.S., Kim, J., Lee, T.K., Park, J. (2022) Commuters health risk associated with particulate matter exposures in subway system - Globally, Building and Environment, 216, 109036.
[https://doi.org/10.1016/j.buildenv.2022.109036]

- World Health Organization (WHO) (2021) WHO global air quality guidelines: particulate matter (PM2.5 and PM10), ozone, nitrogen dioxide, sulfur dioxide and carbon monoxide, (accessed on Sep 12, 2022).
-
Yang, X., Zhang, W., Fan, J., Yu, J., Zhao, H. (2018) Transfers of embodied PM2.5 emissions from and to the North China region based on a multiregional input-output model, Environmental Pollution, 235, 381-393.
[https://doi.org/10.1016/j.envpol.2017.12.115]

-
Yeo, M., Kim, Y. (2019) Trends of the PM10 concentrations and high PM10 concentration cases in Korea, Journal of Korean Society for Atmospheric Environment, 35(2), 249-264, (in Korean with English abstract).
[https://doi.org/10.5572/KOSAE.2019.35.2.249]

- Yeosu City Hall (2021) Population and household status in December 2020. https://www.yeosu.go.kr/www/govt/stats/stats_popul?idx=182567&mode=view&page=2, , (accessed on Jan 25, 2023).
최민석 (전북대학교 석사과정) (cms@jbnu.ac.kr)
김용현 (전북대학교 조교수) (ykim84@jbnu.ac.kr)


