A Study of the Urban Heat Island in Seoul using Local Analysis System
Copyright © 2014 Korean Society for Atmospheric Environment
A very high resolution weather analysis system (VHRAS) of 50 m horizontal resolution is established based on LAPS. VHRAS utilizes the 3 hourly forecast data of the Unified Model (UM) of the Korea Meteorological Administration (KMA) with the horizontal resolution of 12 km as initial guess fields. The analysis system ingests the automatic weather station (AWS) data as input observations. The analysis system operates every hour for Seoul, Korea region in real time basis. It takes less than 10 minutes for one analysis cycle. The size of grid of the analysis domain is 800×660, respectively. The analysis results from December 2010 to February 2011 showed that the mean biases of temperature, maximum and minimum temperature were -0.07, 1.6, 0.2oC, respectively. The temperature in the central part of the city revealed relatively higher value than that of the surrounding mountainous areas, which showed a heat island feature. The heat island appears in zonal direction since the central city region is developed along a large river. Along the heat island, the eastern region was warmer than the western region. The warmer temperature in the western part of the heat island was caused by anthropogenic heat change in conjunction with the change of land use. This system will provide more reliable weather data and information in Seoul.
Keywords:
LAPS, Urban Heat Island (UHI), Urban Heat intensity, Seoul UHI1. 서 론
도시 열섬현상 (UHI: Urban heat island)이란 도시기온이 주변 외곽 또는 시골지역의 기온보다 더 높은 인공 열섬이 되는 현상을 말한다. 이 현상은 도시의 대기질, 에너지 소비량, 열과 관련된 질병 그리고 지역 규모의 대기 순환에 영향을 준다. 도시화는 지표 특성을 상당히 변화시키고 이것은 지표 에너지수지에도 영향을 미치게 된다. 열섬현상은 일차적으로 도시와 도시주변의 지표 에너지 수지의 차이로 인해 발생하는데 (Oke, 1982), 이로 인하여 도시에서는 도시주변보다 더 많은 열을 저장하고 배출하게 된다. 도시의 환경은 구조물들로 인해 닫힌 공간이 많으며 지표 특성으로 인해 많은 열용량을 가지므로 냉각속도가 느리다 (Grimmond and Oke, 1995). 반면에 도시주변 지역은 도시지역에 비해 열린 공간이기 때문에 기온이 빨리 냉각된다. 이러한 특징을 가진 도시지역은 도시를 형성하고 있는 구성요소들에 의해 도시 열섬현상의 원인이 되고, 최근에는 도시기후 변화와 함께 환경뿐만 아니라 경제적 피해를 가져오고 있다. 특히, 겨울철은 적은 일사량 및 강한 바람 등의 자연적 요인으로 인해서 난방, 산업활동에 따른 인공열, 도시의 건축물 또는 도로 피복 등의 인공적인 요인에 의한 열섬현상의 발생이 뚜렷한 계절이다(Ichinosw et al., 1999).
도시열섬의 구조와 특성은 도심지역의 바람, 강수, 대기오염 물질의 확산과도 관련이 깊기 때문에 이러한 도시열섬의 특성을 설명하기 위한 수많은 연구들이 수행되어 왔다. 지난 몇 년 동안 도시 열섬현상의 형성에 대한 이해를 위해 수치모델링을 통한 연구가 진행되어 왔고 (Martilli, 2007; Masson, 2006), 또한 여러 사례연구와 함께 정교한 대기 모델의 개발이 진행되고, 모수화기법들이 제시되고 있다 (Liu et al., 2006; Kanda et al., 2005; Martilli et al., 2003; Kusaka et al., 2001).
서울은 서울 내 인구와 도심의 확장이 빠른 도시이며, 도시 열섬현상의 연구가 활발히 진행되고 있다. 그러나 대부분 서울의 조밀한 AWS 측 자료를 이용하여 통계적 기법이나 수학적 방법들을 사용하여 연구가 진행되어 모델을 이용한 분석은 적은 수준이다. 본 연구는 기상예측장을 이용한 지역규모분석시스템을 통해 기존의 통계처리 방법과는 다른 기상분석 방법을 제시하고자 한다.
따라서, 서울 열섬현상의 시공간적 구조를 수치분석모델인 LAPS(Local Analysis and Prediction System)를 이용하여 고해상도로 분석하여, 2010년 12월 2011년 1, 2월 나타난 서울의 기온분포에 대해 살펴보고자 한다.
2. 연구 방법
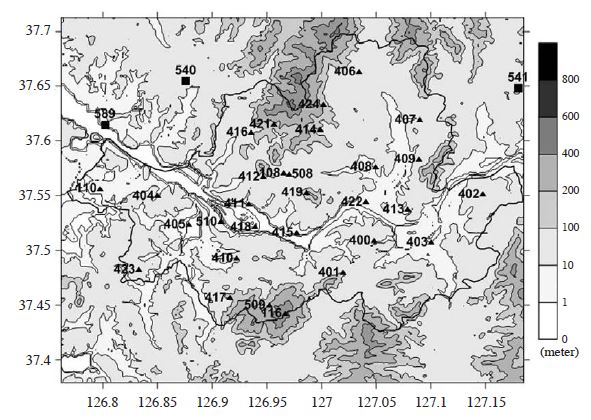
본 연구에서 사용한 자료는 서울 지역과 서울 주변에 분포한 33개 지점의 자동 기상관측기 (AWS: Automatic Weather Station)의 측정자료를 사용하였다. 자동기상관측요소는 기온이며 기상청의 정시 기온자료를 사용하였다. 그리고 서울 도시열섬 분석 시스템인 Local Analysis and Prediction System (LAPS)는 NOAA (National Oceanic and Atmospheric Administration) 산하 GSD(Global Systems Division)에서 개발한 기상 분석 알고리즘이다. LAPS의 알고리즘은 미국 NOAA/GSD/FAB (Forecast Applications Branch)에서 1987년 처음 개발을 시작하였으며, 수집가능한 모든 기상관측자료를 이용하여 고해상도의 분석을 수행하며, 생산된 분석 및 예보자료는 3차원 표출 프로그램을 통하여 수요자의 요구에 따라 가시화 할 수 있다 (Albers et al., 1996; Albers, 1995; Birkenheuer, 1992; McGinley et al., 1991). LAPS는 여러 가지 자료가 서로 연관되어 각각의 분석 결과가 다른 기상분석 시에 이용된다. 이번 연구의 결과는 지상분석 과정을 통해 분석된 결과를 나타내었다. 지상 분석과정은 (surface analysis: McGinley, 1989) 각 관측소에서 관측된 자료가 입력되면 자료 품질 검사과정을 거치게 된다. 자료 품질 검사 과정에는 기후, 연속성, 표준편차 검증 등의 과정을 거치게 된다. 품질 검사를 거친 자료들은 분석 영역의 격자 점 값으로 객관 분석하기 위하여 분석 영역 안쪽 격자점에서는 cubic spline 법에 의해 객관 분석되고 분석 영역의 가장자리에서는 Barnes 스킴을 이용하여 분석이 수행된다. 객관분석과정에는 변분법과 단변수 최적 내삽법을 이용하여 오차를 최대한 억제한다. 또한 기존의 LAPS에 이용되는 지형자료는 NOAA/FSL (Forecast Systems Laboratory)에서 제공하는 전구 1 km 해상도 지형자료를 원시 지형자료로 사용하고 있다. 1 km 해상도의 원시지형자료를 사용하여 생성한 LAPS의 지형이 고해상도의 기상분석시스템의 지형을 제대로 반영하지 못하는 문제점이 발생하였기 때문에 이 시스템의 지형자료를 국토지리정보원의 자료로 갱신함으로써 분석 결과를 현실에 보다 가깝게 개선하였다. 국토지리 정보원의 수치표고 자료는 격자해상도가 10m×10m로 수치지도 등고선 및 표고 기준점들을 내삽하거나 불규칙삼각망(Triangulated Irregular Network, TIN) 모델을 격자화한 지형 래스터자료로 2002년에 구축한 것을 사용하였다. 고해상도 입력자료 개선을 위해 자료 서브루틴 작성 및 기존 LAPS 지형자료 처리과정을 수정하여 타 지역의 고해상도 지형자료 생산에 적용 가능하도록 구성하였다.
LAPS의 초기 추정장으로는 기상청 수치예보과의 3시간 간격 12 km 해상도 통합모델 지역예보장이(Unified Model Regional: UMRG) LAPS 격자점으로 내삽되고, AWS 자료를 자료동화하여 분석하였다. AWS 자료는 기상청 AWS 관측망에서 1분 간격으로 기상청 데이터베이스에 binary 형태로 저장되는 자료를 해독하여 LAPS의 지상자료 입력형식으로 변환하여 사용하였다. 분석영역은 서울 주변지역을 포함하여 50 m 격자 간격의 800×660개의 수평 격자수(40km×33 km)의 영역으로 설정하였다.
3. 결과 및 고찰
3. 1 LAPS분석값과 관측값의 비교
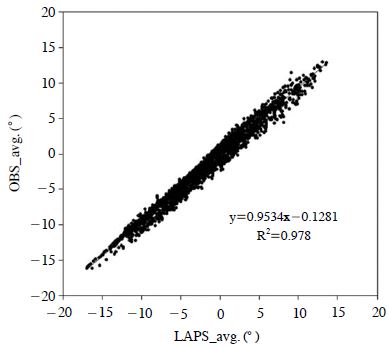
본 연구에서 2010년 11월부터 2011년 2월까지의 자료를 사용하여 LAPS분석 결과와 AWS 관측자료의 연관성 및 관계성을 확인하기 위해서 통계분석을 하였다 (표 1). 정확도 및 오차를 나타내는 방법으로는 관측값과 모델값을 비교하여 오차를 판별하는 Bias (mean error), 모델로부터 산출되는 자료의 정확성을 나타내는 RMSE(Root Mean Square Error), MAE(Mean Absolute Error)를 이용하였다. LAPS의 분석값을 관측값과 비교한 결과, 온도의 분석값은 실험기간 내내 관측값과 거의 일치하였고, 선형회귀법에서 결정계수가 R2=0.9 이상으로 기울기가 거의 1 : 1 관계로 나타났다(그림 2, 3). 기온은 연속적인 변수로 대부분 조건에서 시간, 공간에 따라 유연하게 변하는데 이러한 변화는 대기역학이나 고도(Pielke and Mehring, 1977), 지표 특성 (식물, 토양수분 (Marshall et al., 2004a, b))에 따라 예측이 가능하다. LAPS 분석시 이러한 알고리즘들이 분석 영역 내에서 적절히 반영 되었음을 알 수 있다. 그림 4에서 Bias를 비교해 보면 전지점 평균 Bias는 -0.07oC로 LAPS가 온도를 과 소모의 하고 있음을 알 수 있다. 전 지점 중에서 Bias가 가장 큰 지점은 해발고도가 높은 관악산과 북한산 지점으로 약 1.6oC이고, 밤시간에 최저온도를 과대모의 하는 경향을 나타냈다. 반면에 Bias가 가장 작은 지점은 송파, 마포 지점으로 약 0.2oC 차이가 났다. 지형이 복잡한 산악지역의 경우 LAPS의 초기 추정장이 되는 격자간격 10 km 이상의 중규모 모델이 모의하는데 한계가 있으며(Miao et al., 2007; Ferretti et al., 2003), 계절별로 변화하는 산지의 지표특성(forest cover)이 LAPS에 정확하게 반영되기 어렵기 때문에 LAPS분석의 오차가 증가한다고 알려져 있다(Hiemstra et al., 2006).
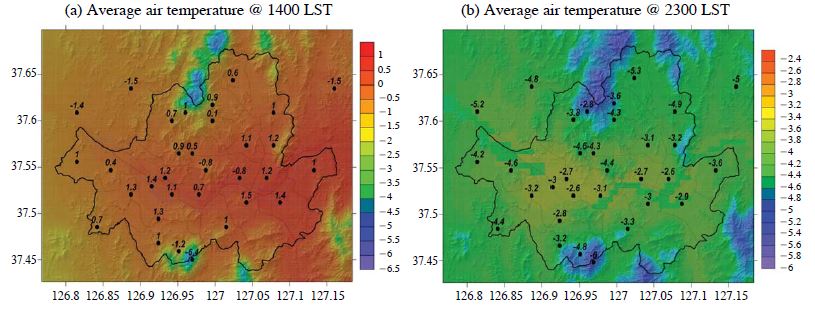
모델과 관측값과의 공간적 분포를 알아보기 위해서 한 낮인 14시와 한밤중의 23시의 기온을 그림 4에 나타내었다. 서울은 대체적으로 송파, 용산 등과 같은 도심지역을 중심으로 고온이 나타났고, 도심외곽으로 갈수록 기온이 낮아졌으며 해발고도가 높은 북한산, 관악산 지역에서 최저 기온이 나타났다. 과거 서울의 수평 기온 분포를 연구한 기존 결과 (기상연구소, 1988)와 비교하였을 때 과거와 유사한 결과가 나타났다.
그림 4를 보면 도시효과는 낮시간보다 야간에 뚜렷하게 나타나고 있음을 알 수 있다. 한밤중의 도심의 온도는 도심 주변의 온도보다 3oC 이상 높게 나타나는데 (그림 4b), 이것은 열섬의 형성과 관련하여 Oke (1982)에서 언급한 내용과 일치하며 서울의 도시 열섬현상은 밤에 더 강하게 나타난다는 기존의 연구와도 (Koo et al., 2007) 일치하고 있다. LAPS는 서울을 50 m 해상도로 분석하여 지형이나 지표이용도에 따른 온도변화를 잘 모사하고 있다. 또한 서울 도심과 서울 외곽을 둘러싼 산지의 온도 대비도 명확하게 분석해 내고 있음을 알 수 있다.
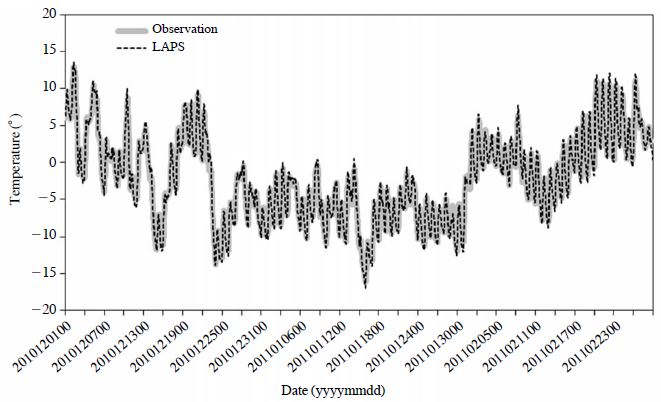
Observation (solid gray line) and LAPS (dotted black line) hourly air temperature, averaged over the all measurement sites.
3. 2 도시열섬강도
서울의 도시열섬강도의 시간적, 공간적 특성을 알아보기 위해서 도심 지점으로는 서초지역을 도시외곽지점으로는 사능, 능곡, 고양을 선정하여 세 지점의 기온을 평균하여 비교 분석하였다 (Kim and Baik, 2005, 2004). 표 2는 8시, 14시 그리고 23시의 LAPS와 관측값의 열섬강도이다. 도시열섬강도는 일변화를 보이면서 주간보다는 야간에 높게 나타나며 특히 01시에 가장 높고 (3.08oC) 15시에 가장 낮다 (0.05oC). 이른 아침의 열섬은 거의 사라지게 되는데 이는 도시외곽의 온도가 일출에 의해 도심보다 더 빨리 상승하기 때문이다 (Bassara et al., 2008; Oke, 1982). 또한 주간의 열섬강도는 일반적인 결과(Memon et al., 2009)와 같이 오전이나 한밤중에 비해 가장 낮은 결과가 나타났지만, LAPS 분석결과는 그 크기를 다소 과대 모의하고 있다. 그리고 야간에는 열섬강도가 2이상으로 열섬현상이 뚜렷하게 나타나는 것을 알 수 있고, LAPS도 야간 도심의 온도가 높게 유지되는 결과를 분석해 내고 있었다. 이는 다른 지상 관측 및 수치모델 연구에서 나타난 결과들과 일치한다(Gian-naros and Melas, 2012; Papanastasiou and Kittas, 2011; Miao et al., 2009; Bassara et al., 2008; Christen and Vogt, 2004). 일출에 이어 나타나는 열섬강도의 감소 역시 잘 분석해 내고 있는데 이것은 도시외곽지역이 도심지역에 비하여 일출에 의한 가열속도가 더 빠르기 때문에 일어나는 낮 시간의 도시열섬현상의 특성이다(Oke, 1982).
그림 5는 연구기간동안 도시 열섬강도의 (a) 빈도 분포와 (b) 최대 열섬강도가 나타나는 시간의 빈도 분포를 나타낸다. 2010년 겨울에 도시 열섬강도는 관측과 LAPS 모두 대체로 2~4oC에서 가장 높은 빈도를 보이며 0~2oC, 8~10oC 구간에서 가장 낮게 나타난다. 그림 5a에서 도시 열섬강도의 각 구간별 빈도 분포 발생 비율은 0~2oC에서 16.0 (16.3)%, 2~4oC에서 38.2 (37.4)%, 4~6oC에서 25.4 (23.3)%, 6~8oC에서 8.9 (8.8)%, 마지막으로 8~10oC에서는 6.4(5.9)%로 나타난다(괄호안의 값은 LAPS의 비율). 그림 5b에서 시간대에 따른 일 최대 열섬강도 일수는 또한 주로 야간에 빈번하고 주간에 낮은 빈도를 보이는 것을 알 수 있다.
그림 6은 서울 도시 열섬의 공간적 변화를 분석하기 위해 연구기간 중 맑은 날 야간의 평균기온의 편차의 분포를 비교한 것이다. 기온의 편차는 시공간 평균으로부터의 기온편차를 나타내며, 운량이 3 미만이며 2100~0300 LST 정시자료를 이용하였다. 관측과 LAPS 분석으로 나타난 서울의 편차 분포는 동서로 고온의 영역이 나타나고 있었다. 고온이 나타난 지역은 도시화 및 택지개발이 이루어진 상업, 주거지역으로 열용량이 큰 토지피복으로 인해 기온의 증가가 이루어진 것으로 분석된다(Kim and Baik, 2005).
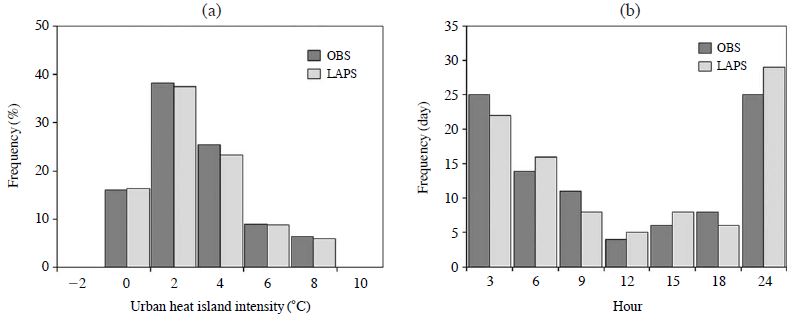
(a) Distribution of Frequency of the urban heat island intensity and (b) maximum urban heat island intensity time by observation and LAPS.
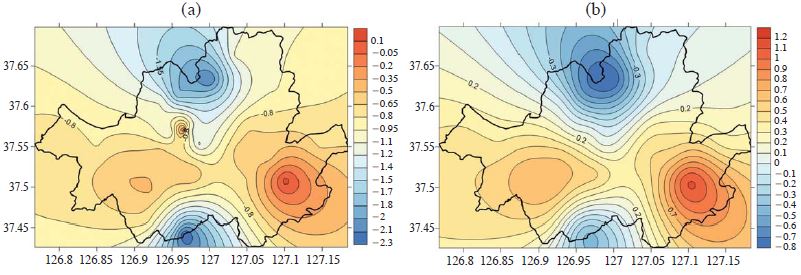
The distribution of (a) observation and (b) LAPS temperature anomaly for winter nights (2100~0300 LST).
Kim and Baik (2001)의 결과와 비교해 보면 서울의 동쪽지역에서 고온 영역이 크게 확장되었으며, 남서지역에 나타나던 고온의 영역이 줄고 영등포지역으로 고온영역이 확대되어 나타나는 것을 알 수 있었다. 2001년에는 고온핵의 중심이 동대문, 용산, 한강 등에서 주로 나타났으나 2010년에는 광진구와 영등포 지역에서 나타났다. 이러한 결과와 같이 기온편차의 최대 값은 관측값과 LAPS 모두 송파(OBS : 1.4, LAPS : 0.17)로 나타나는 것을 알 수 있다.
4. 결 론
본 연구에서 2010년 12월, 2011년 1, 2월 동안 수집된 AWS관측 데이터와 LAPS를 이용해서 2010년 겨울 서울의 도시 열섬 현상의 효과를 분석하고 구현하였다. 관측자료와 LAPS로 분석된 온도자료를 이용하여 서울 도시열섬의 시∙공간적 구조를 분석하고, LAPS의 성능을 평가하였다.
LAPS와 AWS의 시간별 평균기온을 비교해 본 결과 AWS 관측자료와 LAPS 분석자료가 잘 일치하며 공간적인 분포도 잘 나타내는 것으로 분석되었다. 서울의 도시 열섬은 이른 아침에 도심과 도시 외곽지역의 온도차가 덜 뚜렷한 반면 밤시간에 도심에서 강한 열섬 현상이 나타나는 특성을 가지고 있었다. 서울의 낮동안 일어나는 열섬의 과정은 Oke (1982)의 이론과 잘 일치하고 있었다. 열섬현상은 밤에 더 두드러지게 나타나며 일출과 일몰 이후에 급격하게 줄어들었다. 하루 동안 도시의 표면은 도시 열 소멸(heat sink; Keramitsoglou et al., 2011)의 역할을 하며 이러한 이유로 야간에 도심은 그 주변보다 따듯한 현상이 발생한다.
본 연구의 분석 결과를 바탕으로 AWS와의 상관관계를 나타내었을 때, AWS 자료를 자료동화한 기법의 적용이 효율적인지에 대한 추가 연구가 필요할 것으로 판단되며, AWS 자료를 입력하지 않은 지점에서의 LAPS 결과의 공간적 정확성 혹은 영향반경의 효과 또한 고려하여 분석해야 할 것으로 판단된다.
Acknowledgments
본 연구는 기상청 차세대도시농림융합스마트기상서비스개발(WISE) 사업의 지원으로 수행되었습니다(153-3100-3133-302-350).
References
- Ahrens, C.D., Meteorology Today: An Introduction to Weather, Climate, and the Environment, 7th ed, Thomson Brooks Cole, (2003), p624.
-
Albers, S.C., The LAPS wind analysis, Weather and Forecasting, (1995), 10, p342-352.
[https://doi.org/10.1175/1520-0434(1995)010<3C0342:TLWA>3E2.0.CO;2]

-
Bassara, J.P., P.K. Hall Jr, A.J. Schroeder, B.G. Illston, K.L. Nemunaities, Diurnal cycle of the Oklahoma City urban heat island, Journal of Geophysical Research, (2008), 113, p1-16.
[https://doi.org/10.1029/2008JD010311]

-
Birkenheuer, D., The effect of using digital satellite imagery in the LAPS moisture analysis, Weather and Forecasting, (1999), 14, p782-788.
[https://doi.org/10.1175/1520-0434(1999)014<3C0782:TEOUDS>3E2.0.CO;2]

- Boo, K.O., S.N. Oh, Characteristics of Spatial and Temporal Distribution of Air Temperature in Seoul, Korean Journal of Meteorological Society, (1999), 36(4), p499-506.
- Boo, K.O., Y.S. Chun, J.Y. Park, H.M. Cho, W.T. Kwon, The horizontal distribution of air temperature in Seoul using automatic weather station data, Asia-Pacific Journal of Atmospheric Sciences, (1999), 35(3), p335-343.
-
Christen, A., R. Vogt, Energy and radiation balance of a central European city, International Journal of Climatology, (2004), 24, p1395-1421.
[https://doi.org/10.1002/joc.1074]

- Ferretti, R., G. Mastrantonio, S. Argentini, R. Santoleri, A. Viola, A modelaided investigation of winter thermally driven circulation on the Italian Tyrrhenian coast: a case study, Journal of Geophysical Research, (2003), 108(24), p4777.
-
Giannaros, T.M., D. Melas, Study of the urban heat island in a coastal Mediterranean city: the case study of Thessaloniki, Greece, Atmospheric Research, (2012), 118, p103-120.
[https://doi.org/10.1016/j.atmosres.2012.06.006]

-
Grimmond, C.S.B., T.R. Oke, Comparison of heat fluxes from summertime observations in the suburbs of four North American cities, Journal of Applied Meteorology, (1995), 34, p873-889.
[https://doi.org/10.1175/1520-0450(1995)034<3C0873:COHFFS>3E2.0.CO;2]

-
Hiemstra, C.A., G.E. Liston, R.A. Pielke, D.L. Birkenheuer, S.C. Albers, Comparing Local Analysis and Prediction System (LAPS) Assimilations with Independent Observations, Weather and Forecasting, (2006), 21(6), p1024-1040.
[https://doi.org/10.1175/WAF961.1]

-
Ichinose, T., Shimodozone, K. Hanaki, Impact of anthropogenic heat on urban climate in Tokyo, Atmospheric Environment, (1999), 33, p3897-3909.
[https://doi.org/10.1016/S1352-2310(99)00132-6]

-
Kanda, M., T. Kawai, M. Kanega, R. Moriwaki, K. Narita, A. Hagishima, A simple energy balance model for regular building arrays, Boundary-Layer Meteorology, (2005), 116, p423-443.
[https://doi.org/10.1007/s10546-004-7956-x]

-
Keramitsoglou, I., C.T. Kiranoudis, G. Ceriola, Q. Weng, U. Rajasekar, Identification and analysis of urban surface temperature patterns in Greater Athens, Greece, using MODIS imagery, Remote Sensing of Environment, (2011), 115, p3080-3090.
[https://doi.org/10.1016/j.rse.2011.06.014]

- Kim, J.Y., Y.S. Ghim, Utilization of AWS Wind Data for Photochemical Modeling of Greater Seoul area, The Journal of Korean Society for Atmospheric Environment, (1999), 1, p61-62.
- Kim, J.Y., Y.S. Ghim, K.Y. Chung, Analysis of Wind Data Characteristics of Automatic Weather Stations in Seoul and Inchon Areas, Korean Journal of Meteorological Society, (2000), 36(2), p153-166.
-
Kim, Y.H., J.J. Baik, Daily maximum urban heat island intensity in large cities of Korea, Theoretical and Applied Climatology, (2004), 79, p151-164.
[https://doi.org/10.1007/s00704-004-0070-7]

-
Kim, Y.H., J.J. Baik, Spatial and temporal structure of the urban heat island in Seoul, Journal of Climate and Applied Meteorology, (2005), 44, p591-605.
[https://doi.org/10.1175/JAM2226.1]

- Kim, Y.S., S.E. Hwang, J.H. Oh, The implementation and test of LAPS for Korean peninsula, Korean Journal of Meteorological Society, (2000), 4, p235-238.
-
Kusaka, H., H. Kondo, Y. Kikegawa, F. Kimura, A simple single-layer urban canopy model for atmospheric models: comparison with multi-layer and slab models, Boundary-Layer Meteorology, (2001), 101, p329-358.
[https://doi.org/10.1023/A:1019207923078]

-
Lee, J.B., J.C. Kim, Y.J. Jang, A Study of Urban Heat Island in Chuncheon Using WRF Model and Field Measurements, Journal of Korean Society for Atmospheric Environment, (2012), 28(2), p119-130.
[https://doi.org/10.5572/KOSAE.2012.28.2.119]

-
Marshall, C.H., R.A. Pielke, L.T. Steyaert, Has the conversion of natural wetlands to agricultural land increased the incidence and severity of damaging freezes in south Florida?, Monthly Weather Review, (2004a), 132, p2243-2258.
[https://doi.org/10.1175/1520-0493(2004)132<3C2243:HTCONW>3E2.0.CO;2]

-
Martilli, A., Current research and future challenges in urban mesoscale modeling, International Journal of Climatology, (2007), 27, p1909-1918.
[https://doi.org/10.1002/joc.1620]

-
Martilli, A., Y.A. Roulet, M. Junier, F. Kirchner, M.W. Rotach, A. Clappier, On the impact of urban surface exchange parameterizations on air quality simulations: the Athens case, Atmospheric Environment, (2003), 37, p4217-4231.
[https://doi.org/10.1016/S1352-2310(03)00564-8]

-
Masson, V., Urban surface modeling and the meso-scale impact of cities, Theoretical and Applied Climatology, (2006), 84, p35-45.
[https://doi.org/10.1007/s00704-005-0142-3]

-
McGinley, J.A., S.C. Albers, P.A. Stamus, Validation of a composite convective index as defined by a real-time local analysis system, Weather and Forecasting, (1991), 6, p337-356.
[https://doi.org/10.1175/1520-0434(1991)006<3C0337:VOACCI>3E2.0.CO;2]

-
Memon, R.A., D.Y.C. Leung, C.-H. Liu, An investigation of urban heat island intensity (UHII) as an indicator of urban heating, Atmospheric Research, (2009), 94, p491-500.
[https://doi.org/10.1016/j.atmosres.2009.07.006]

-
Miao, J.F., D. Chen, K. Borne, Evaluation and comparison of Noah and Pleim-Xiu land surface models in MM5 using GOTE2001 data: spatial and temporal variations in near-surface air temperature, Journal of Applied Meteorology and Climatology, (2007), 46, p1587-1605.
[https://doi.org/10.1175/JAM2561.1]

-
Mitchell, K.E., Coauthors , The multi-institution North American Land Data Assimilation System (NLDAS): Utilizing multiple GCIP products and partners in a continental distributed hydrological modeling system, Journal of Geophysical Research, (2004), 109(D07S90).
[https://doi.org/10.1029/2003JD003823]

-
Oke, T.R., The energetic basis of the urban heat island, Quarterly Journal of the Royal Meteorological Society, (1982), 108, p1-24.
[https://doi.org/10.1002/qj.49710845502]

-
Papanastasiou, D., C. Kittas, Maximum urban heat island intensity in a medium-sized coastal Mediterranean city, Theoretical and Applied Climatology, (2011), 107, p407-416.
[https://doi.org/10.1007/s00704-011-0491-z]

-
Pielke, R.A., Influence of the spatial distribution of vegetation and soils on the prediction of cumulus convective rainfall, Reviews of Geophysics, (2001), 39, p151-177.
[https://doi.org/10.1029/1999RG000072]

- Rho, C.S., On the rising trend of air temperature in Seoul area, Asia-Pacific Journal of Atmospheric Sciences, (1973), 1, p49-58.
