서울 여름철 내화성 블랙카본의 질량과 입경분포 분석
Copyright © 2019 Korean Society for Atmospheric Environment
Abstract
Black carbon (BC), a primary aerosol emitted by the combustion of fossil fuel and biomass, is the subject of scientific attention as its impacts on atmospheric pollution, human health and climate change. In the present study, the refractory BC (rBC) measurement method using a single particle soot photometer (SP2, DMT) was validated by developing and optimizing a precise calibration system. We measured mass and number concentrations and size distributions of ambient rBC in Seoul during 2019 summer. The mean mass and number concentrations of rBC particles were 0.58±0.32 μg m-3 and 336±190 # cm-3, respectively. The maximum count diameter of rBC was always found at around 70~80 nm, close to the lower detection limit, and the mass median diameter (MMD) of rBC was 119±5 nm on average. The elemental carbon (EC) mass concentration measured using a thermal-optical method (TOT) was 35% higher than that of rBC, which was likely associated with the differences in measured size range, refractory properties, and measurement uncertainties between two methods. The results clearly indicate that rBC particles in Seoul during summer was highly subject to urban local vehicle emissions.
Keywords:
Black carbon, SP2, Size distribution, Emission source1. 서 론
블랙카본 (black carbon, BC)은 화석연료 연소와 식생소각에 의하여 대기중으로 직접 배출되는 에어로졸이다. 블랙카본은 에어로졸 (aerosol) 중 가시광선을 가장 강하게 흡수하는 광흡수물질 (Bond et al., 2013)로 알려져 있으며, 수농도가 주로 100 nm 이하에 집중되어 나타나는 나노입자이기 때문에 타 대륙과 극지역까지 쉽게 이동한다 (Lim et al., 2017; Zhou et al., 2012). 따라서 지역적, 전지구적 측면의 지구온난화를 야기하는 에어로졸 성분으로서 기후변화 측면에서 그 연구의 중요성이 크다 (Boucher et al., 2013). 도심에서는 자동차 이동발생원, 공장 굴뚝과 같은 고정발생원으로부터 주로 배출되기 때문에 도심 배출 지시자로 이용된다. 또한 최근에는 도심 대기질 저하로 인해 인간의 건강에 심각한 영향을 끼치는 물질로 보고되었다 (Janssen et al., 2012, 2011).
전지구적으로는 화석 및 식물성연료 연소에 의한 배출이 블랙카본 전체 배출의 60% 이상을 차지하고, 지역별 주요 배출원은 매우 상이한 편이다. 동아시아는 인도와 함께 블랙카본 인위적 배출의 핵심지역으로 주목되고 있다 (Chung and Seinfeld, 2005). 동아시아 최대 배출지인 중국에서의 주요 블랙카본 배출원은 주거, 난방, 농업 관련 석탄 및 식물성연료 연소이다 (Ni et al., 2014; Wang et al., 2012). 이러한 배출원으로부터 발생한 블랙카본은 광흡수 특성으로 인해 대기경계층을 안정화시켜 고농도 PM2.5 사례를 보다 심화시킬 수 있다고 보고되고 있다 (Lou et al., 2019; Ding et al., 2016).
대한민국 수도권은 중국의 풍하에 위치하여 중국 배출과 수도권 국지배출 영향을 모두 받기 때문에 계절별 블랙카본의 정확한 질량농도뿐 아니라 입경분포를 이용한 배출 및 대기중 노화정도에 관한 분석이 필요하다. 배출원에서의 블랙카본은 물리적으로 소수성이지만 배출원으로부터 이동되면서 빠르게 서로 응집되고 결과적으로 입경이 증가한다. 한편 함께 배출된 친수성 기체상 물질이 블랙카본 표면에 응결하고 코팅을 형성하면서 (Kiselev et al., 2010; Zhang et al., 2008) 블랙카본의 혼합상태가 변화한다. 즉, 블랙카본은 배출원으로부터 이동되면서 화학적으로 보존적 추적자 (conservative tracer)로서의 성격은 유지하면서 입경은 증가하고 (Ohata et al., 2016) 표면반응에 의하여 에어로졸 이차 생성 및 성장에도 기여할 수 있다.
현재 블랙카본 단일입자단위 물리적 특성 측정은 레이저-유도 백열 (laser-induced incandescence) 방법을 이용하는 single particle soot photometer (SP2, DMT)로만 가능하다. SP2는 레이저를 흡수한 후 증발점에서 백열하는 내화성 블랙카본 (refractory black carbon, 이하 “rBC”)의 입자별 질량과 입경을 측정한다. 그 외에 가장 널리 사용되는 블랙카본 측정방법은 열분해법 (thermal method)을 바탕으로 하여 무기탄소 (elemental carbon, 이하 “EC”)의 질량농도를 측정하는 열광학적 투과법 (Thermal-optical transmittance method; TOT) 및 열광학적 반사법 (Thermal-optical reflectance method; TOR)과 블랙카본의 광흡수계수를 측정후 질량농도 (equivalent BC, eBC)로 환산하는 광학적투과법 (optical transmittance method)이 있다. 위 두 측정방법들로부터 산출된 블랙카본 질량농도는 함께 존재하는 광흡수유기탄소와 코팅물질에 의한 간섭으로부터 자유로울 수 없으며, 결과적으로 SP2로 측정한 rBC 농도와 차이가 발생한다 (Sharma et al., 2017; Miyakawa et al., 2016; Wang et al., 2014). 또한 SP2는 in-situ 측정인 반면, 위 두 방법은 필터 포집 기반이므로 필터 자체의 간섭이 있다 (Lee, 2018; Schmid et al., 2006; Weingartner et al., 2003). 국내 블랙카본 측정연구는 대부분 열광학적방법과 광학적투과법을 이용하여 수행되었다. 최근 SP2가 도입되어 배경대기지역인 제주 중산간지대에서 봄철 (5월) (Oh et al., 2015), 서울 불광동에서 늦여름 (9월) (Park et al., 2019)에 대기 중 rBC 측정 연구가 수행되었다.
본 연구에서는 SP2의 교정시스템을 구축하였고, 정밀교정을 수행하여 2019년 여름 서울의 대기 중 rBC 질량 및 수농도와 입경분포를 측정하였다. 구체적으로, EC 질량농도와 비교하면서 상대적으로 외부유입 영향이 적은 여름철 서울 대기 중 rBC의 배출 및 대기중 노화 특성을 분석하고자 한다.
2. 방 법
2. 1 측정
서울시 성북구 안암동 고려대학교 자연계캠퍼스 하나과학관 7층 (37°35ʹN, 127°01ʹE)에서 SP2의 정밀교정 및 지상관측을 수행하였다. 고려대학교는 동쪽으로는 북부간선도로와 내부순환로를 접하고 있고, 북서쪽으로 북한산 국립공원이 자리잡고 있다. 2019년 7월 29일부터 8월 9일까지 SP를 이용하여 rBC를, Sunset 준실시간 탄소분석기를 이용하여 EC를 측정하였다. 강수로 인하여 실험기간 중 부분적으로 측정을 멈추었다 (총 3일 이하).
2. 2 SP2
Single particle soot photometer (SP2, DMT, USA)는 레이저-유도 백열 방법에 기초하여 입자단위 rBC의 질량을 정밀 측정한다 (Schwarz et al., 2006; Stephens et al., 2003). 간략히 기술하자면, 층류를 유도하는 유입구 (laminar flow element, LFE)를 통해 유입된 rBC 단일입자는 1,064 nm Nd:YAG 레이저의 레이저빔을 통과하면서 광에너지를 흡수, 백열하고 또한 산란한다. rBC의 백열 시그널은 2개의 광검파기 (Photomultiplier tube, PMT; broadband와 narrowband)에 의하여 측정되고, 각 광검파기의 시그널은 상대적으로 저성능 (low gain, 이하 “LG”)과 최저검출한계를 낮추기 위하여 LG 시그널을 10배 확대한 채널인 고성능 (high gain, 이하 “HG”)으로 구성되어 있다. 따라서, 백열 채널은 broadband high gain (BBHG), broadband low gain (BBLG), narrowband high gain (NBHG)과 narrowband low gain (NBLG)의 총 4채널로 운용된다. 대기 측정에서는 narrowband의 낮은 signal-to-noise ratio 때문에 broadband detector (BBHG과 BBLG)의 시그널만 이용하였다. 입자의 산란 시그널은 avalanche photo diode (APD)와 two-element APD (TEAPD)에 의하여 측정된다. 입자단위 rBC의 입경은 밀도 (void-free density) 1.8 g cm-3 (Moteki and Kondo, 2010)인 구형으로 가정하여 질량등가입경 (mass-equivalent diamter, DMEV, 이하 “입경”)을 계산하였고 질량 및 수농도 입경분포는 로그정규분포를 따라 피팅하였다.
rBC 질량의 정확도는 교정물질의 선택과 교정 재현성에 직접적으로 영향을 받는다. rBC 질량의 정확도와 정밀도는 1 fg (DMEV≈100 nm) 이상에서 모두 10% 이내로 보고되고 있다 (Lim et al., 2014; Laborde et al., 2012; Gysel et al., 2011). 본 연구에서는 fullerene soot (Alfa Aesar, USA; stock 40971, lot FS12S011)과 aquadag (Acheson Inc., USA) (Gysel et al., 2011; Moteki and Kondo, 2010)으로 SP2의 정밀교정을 수행하여 측정의 신뢰도를 검증하였다. 대기 중 rBC의 유효밀도와 가장 흡사한 fullerene soot의 교정선을 이용하여 대기 중 rBC 질량을 산출하였다. SP2의 측정범위는 rBC의 경우 0.3~130 fg (입경범위 70~510 nm)이었고 510 nm 이상의 큰 입자는 510 nm로 간주하였다. 산란입자 (purely scattering particle)는 180~470 nm 입경 범위에서 측정되었다. SP2 옵틱 (optics) 수명 단축과 산란입자 측정 불확도 증가 등 높은 상대습도로 인한 영향을 최소화하고자 SP2 유입구 상단에 건조기 (diffusion dryer)를 설치하였다.
2. 3 SP2 교정시스템
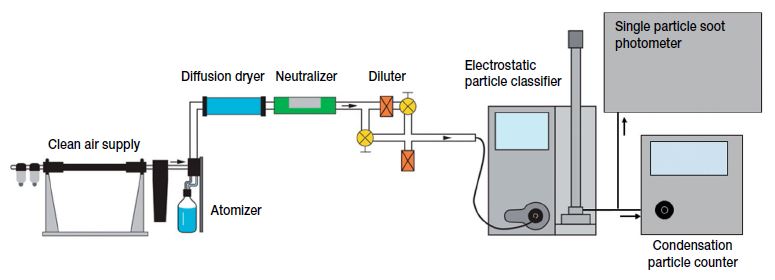
SP2 교정을 위한 시스템은 랩에서 제작하였고, 교정시스템의 모식도는 그림 1과 같다 (Hwang and Ahn, 2017; Lee et al., 2016). 공기압축기를 통해 공급된 공기는 미세먼지가 없는 깨끗한 공기로 시스템 안으로 공급된다 (clean air supply). 입자분무발생장치 (jet nozzle type atomizer)에서 발생된 표준물질 입자는 건조기 (diffusion dryer)에서 수분이 제거되고 soft X-ray ionizer를 사용하는 입자중화기 (soft X-ray neutralizer)로 진입한다. 중화된 입자는 3개의 HEPA filter로 구성된 입자희석기 (dilluter)를 거쳐 미분형전기이동도분석기 (electrostatic particle classifier)로 진입하고, 원하는 입경의 입자만 분리되어 나온다. 선별된 입자는 SP2와 응축입자계수기 (water-based condensation particle counter; Hwang and Ahn, 2017) 양쪽으로 들어간다. SP2와 응축입자계수기에서 측정된 입자 개수를 비교하면서 SP2 교정을 진행한다.
10, 50, 100, 200, 300 nm의 단일입자를 주입하였을 때, 미분형전기이동도분석기로 분리한 입자들의 입경분포의 기하학적 평균입경 (geometric mean diameter)은 3~4% 내에서 일치하였다. 한편, 102~105 particles cm-3 범위 5가지 농도대에서 단일입자를 주입하였을 때, 응축입자계수기로 측정한 입자 수농도는 정밀교정한 TSI사의 응축입자계수기 (모델 3776)의 측정값과 4% 내에서 일치하였다. 따라서, SP2 교정시스템은 위와 같은 성능평가 결과를 바탕으로 신뢰도를 확보하였다.
2. 4 Sunset OCEC, PM2.5와 기상장
SP2 rBC와 함께 준실시간 탄소분석기 (Semi-continuous OC/EC Field Analyzer, Sunset Laboratory INC., USA)로 비교관측을 수행하였다. SP2의 측정 입경범위를 고려하여 이 탄소분석기 유입구에 PM1 싸이클론을 설치하여 1 μm 이하의 입자만 포집하였다. 매 시간 45분간 석영필터에 시료를 포집하고 15분간 NIOSH5040 프로토콜을 기초로 유기탄소 (organic carbon, 이하 “OC”)와 EC를 분석하였다. 오븐 안에 위치한 석영필터에 대기 입자를 포집한 후 단계적으로 분석온도를 높여 탄소가 열분해되어 발생하는 이산화탄소의 양으로 탄소농도를 결정한다. 먼저 온도를 단계적으로 높이면서 헬륨 기체 조건에서 OC가 측정되고, 98% 헬륨과 2% 산소 조건에서 EC가 측정된다. 일반적으로 OC 질량농도 교정을 위한 외부 표준물질로 사용하는 자당 (sucrose: C12H22O11)을 이용하여 산출한 OC의 측정 불확도는 약 10%였다. 석영필터는 약 2~3일 간격으로 교체하였다. EC의 정밀도는 약 30%이다 (Sharma et al., 2017; Panteliadis et al., 2015).
PM2.5 질량농도는 환경부 용두동 집중측정소 1시간 자료를, 기상요소는 기상청 종로구 송월동 1시간 자료를 사용하였다.
3. 결과 및 고찰
3. 1 정밀교정
에어로졸 지상관측에 앞서 SP를 교정하였다. Aquadag과 fullerene soot은 유효밀도로 대표되는 물리적 특성면에서 대기 중 rBC와 가장 흡사하여 SP2 rBC 교정의 최적 표준물질로 알려져 있다 (Gysel et al., 2011; Moteki and Kondo, 2010). 따라서 이 두 표준물질로 백열채널 (Incandescence channel)은 70~500 nm 범위에서 20개의 입경에 대하여 총 3회, polystyrene latex spheres (PSL)로 산란채널 (scattering channel)을 총 2회 교정하였다. 본 연구에서 사용한 SP2의 rBC 측정입경범위는 LG는 80~510 nm, HG는 ~70~320 nm였다. 이론적으로 LG 교정선의 기울기는 HG에 비하여 10배 높아야 한다. 본 정밀교정 실험에서 진행한 HG 교정선 (×10)의 기울이는 표준물질 종류에 상관없이 LG의 것과 10% 범위 내에서 일치하였다 (그림 2a). 또한 aquadag 교정선 기울기 간의 차이는 5% 내에서 일치하였다 (그림 2a).
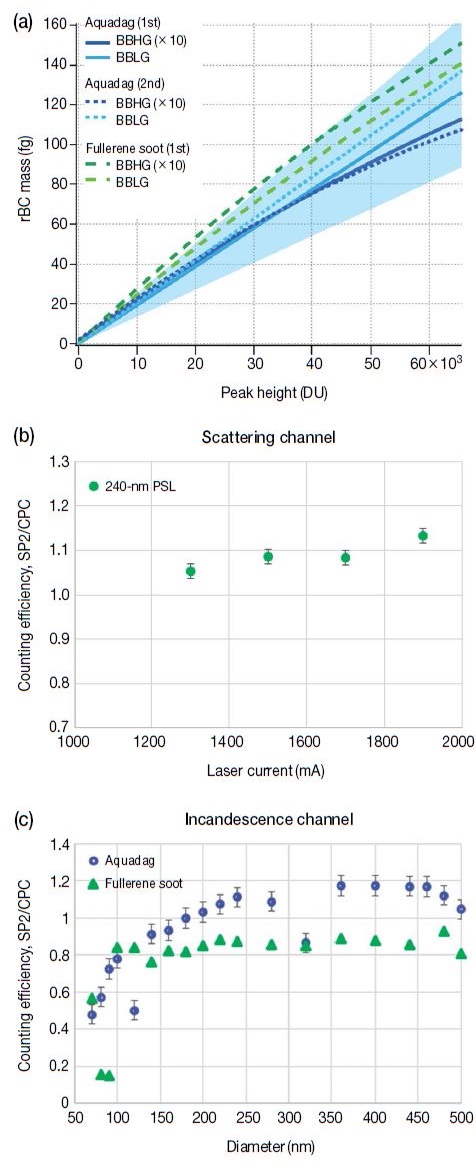
Calibration results conducted for incandescence channel and scattering channel. (a) Comparison of the aquadag and fullerene soot calibrations, (b) Counting efficiency of 240- nm PSL, and (c) Counting efficiency of aquadag and fullerene soot. In (a), the shading indicate the 30% range of 1st LG calibration of aquadag.
선행연구에 의하면 SP2 백열채널 광검파기에서 aquadag과 fullerene soot의 민감도는 다르다 (Laborde et al., 2012; Gysel et al., 2011; Moteki and Kondo, 2010). 이들 선행연구에서 8.9 fg 입자의 [aquadag 피크높이]/[fullerene soot 피크높이] 비는 약 1.3이었다. 본 실험에서의 두 표준물질 간 피크높이 비는 1.28로 기존 실험값과 매우 근접하였다.
PSL은 레이저 효율과 산란입자의 입경 측정을 위해 사용하는 표준물질이다. 레이저 전력을 1,300 mA에서 1,900 mA까지 4단계로 변화시키며 240 nm-PSL의 산란채널에서의 수농도를 기록하고, 동시에 응축입자계수기로 수농도를 측정하였다. SP2 산란채널과 입자계수기 간의 수농도 비를 통해 SP2 산란채널의 입자계수 효율을 살펴보았다 (그림 2b). 두 기기가 최적의 상태라면, 240-nm PSL에 대하여 [SP2 수농도]/[입자계수기 수농도] 비는 1에 가까워야 한다. 실제 이 비는 1.1 내외였고 상대표준편차 (relative standard deviation) ~10% 수준으로 작은 변동성을 보여 입자계수 효율이 안정적임이 입증되었다. 또한 전력이 높아짐에 따라 비가 높아지고 1,900 mA에서 최대값을 보였다. 따라서, 입자계수 효율이 최대인 1,900 mA에서 대기 측정을 진행하였다.
표준물질 Aquadag과 fullerene soot을 이용한 백열채널 교정범위인 70~500 nm에서도 동일한 입자계수 효율 실험을 수행하였다 (그림 2c). 선행연구에서와 같이 100 nm 이하에서는 효율이 작고 (Schwarz et al., 2010), 100 nm 이상에서 [SP2 수농도]/[입자계수기 수농도] 비는 대체로 1에 가까웠다. 위 실험을 통해 SP2 측정의 신뢰도를 확보하여 지상관측을 수행하였다.
3. 2 rBC 농도 및 입경분포
측정기간 동안 1시간평균 온도는 28.4±3.0도, 풍속은 1.7±1.1 m s-1, 상대습도는 74±15%이었다 (그림 3). 풍향은 초반 이틀간 남풍이 우세하였고, 그 후로는 풍향과 풍속이 대체로 일변화 (Sect. 3.3에서 논의)를 보였다.
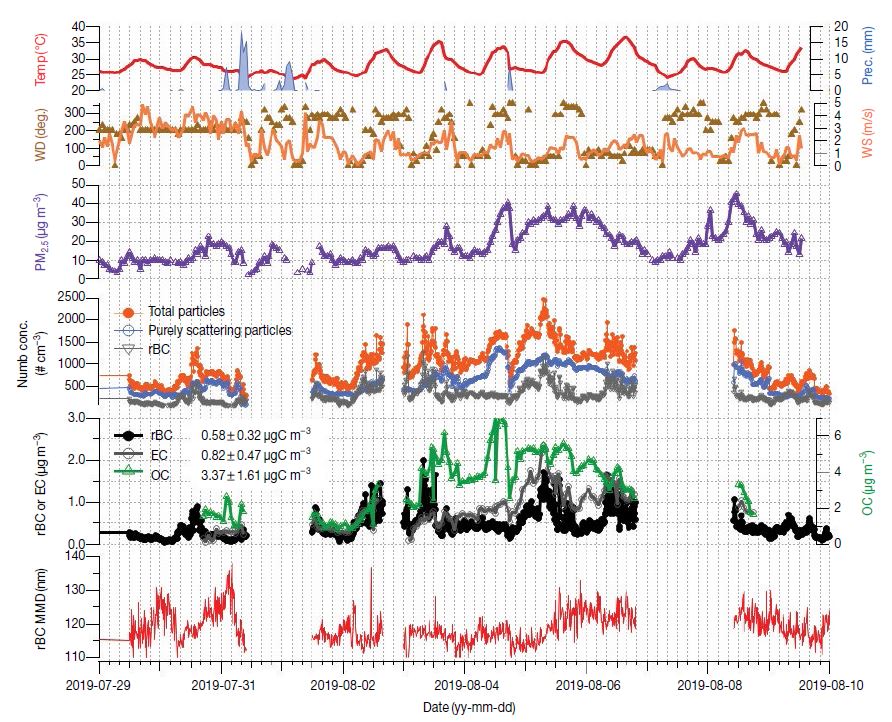
Time-series of aerosol concentrations and sizes and meteorological parameters for the whole measurement period. SP2 data was averaged for 10 minutes, and the others are 1-h averaged.
측정기간 평균 PM2.5 질량농도는 17.6±9.1 µg m-3 로 대부분 국내 대기환경기준으로 “좋음” 혹은 “보통”에 해당하였다. rBC 평균 질량농도는 0.58±0.32 µg m-3이었는데, 이는 PM2.5 질량의 3.2%를 차지한다 (표 1). rBC 평균 수농도는 336±190 # cm-3이었다. SP2로 측정한 전체 입자 (70~510 nm rBC와 180~470 nm 산란입자) 수농도 중 rBC는 32%를 차지하였다. 평균 EC 질량농도는 0.82±0.47 µg m-3, 평균 OC 질량농도는 3.4±1.6 µg m-3이었고, OC/EC 비는 평균 5.3±5.1이었다.

Summary of aerosol measurements conducted at Korea University in Anam-dong, Seoul during 29 July, 2019~9 August, 2019.
본 측정기간의 평균 rBC 질량농도는 2018년 9월 서울 불광동측정소에서의 질량농도 (0.32±0.18 µg m-3)보다 80% 높았다 (Park et al., 2019). 불광동측정소의 rBC는 교통혼잡시간대에 크게 증가하는 농도의 일변화로 보아 주변 자동차 이동오염원의 영향을 크게 받았다고 보고되었다. 불광동측정소의 PM2.5 질량농도는 12.0±5.8 µg m-3으로 본 측정기간의 평균 PM2.5 질량농도 (17.6±9.1 µg m-3)보다 낮았는데, PM2.5 중 rBC 질량 함량도 2.7%로 본 측정기간의 rBC 질량 함량 (3.2%)보다 약간 낮았다. 기상조건과 배출원 외에 본 연구에서 측정한 rBC 질량농도보다 낮은 이유 중의 하나는 동일한 rBC 질량에서 fullerene soot보다 광검파기 시그널의 피크가 ~30% 높은 aquadag (Sect. 3.1. 참조)을 이용하여 SP2를 교정했기 때문이다. 반면, 2013년 5월 제주도에서 측정한 평균 rBC 질량농도 (0.69±0.48 µg m-3)는 본 실험 결과보다 20% 높았다 (Oh et al., 2015). 총 10일의 측정기간 동안 2차례의 중국 유입 고농도 미세먼지사례가 발생하였다고 보고되었다. 중국 북경 도심에서의 선행연구와 비교하였을 때, 본 측정기간의 rBC 질량농도는 북경 여름철 농도의 30~50% 수준이었고 (Liu et al., 2019, 2018), 겨울철 농도보다는 약 10배 낮았다 (Liu et al., 2018; Wang et al., 2016; Wu et al., 2016). 그러나 중국 교외지역 rBC 질량농도보다는 2~3배 높았다 (Wang et al., 2015, 2014). 즉, 본 측정기간 rBC 질량농도 수준은 국지적 도심 배출의 영향을 크게 받았음을 보여준다.
질량농도는 배출량에 따라 크게 변동하므로 질량농도만으로 입자의 배출원을 분명하게 파악하는 데에는 한계가 있다. 따라서 배출원 특성과 대기 중 노화 정도를 보다 분명하게 살펴보기 위하여 rBC 입경분포를 분석하였다. rBC 입경분포를 최대수농도입경과 질량중앙입경 (mass median diameter, 이하 “MMD”)으로 표현하였다. 최대수농도입경은 항상 최소측정한계 부근인 70~80 nm에서 나타났다. MMD는 평균 119±5 nm였고, 최소값과 최대값은 각각 106 nm, 144 nm였다. 측정된 입경범위 (70~510 nm) rBC의 입경분포를 기반으로 로그정규분포를 가정하고 10~1,000 nm 입경범위에서 외삽법으로 복원하면 (그림 4), 측정범위 하단에서의 rBC 질량농도는 rBC 측정농도의 14%였고 (그림 4b), 전체 측정기간 평균적으로는 약 10%였다.
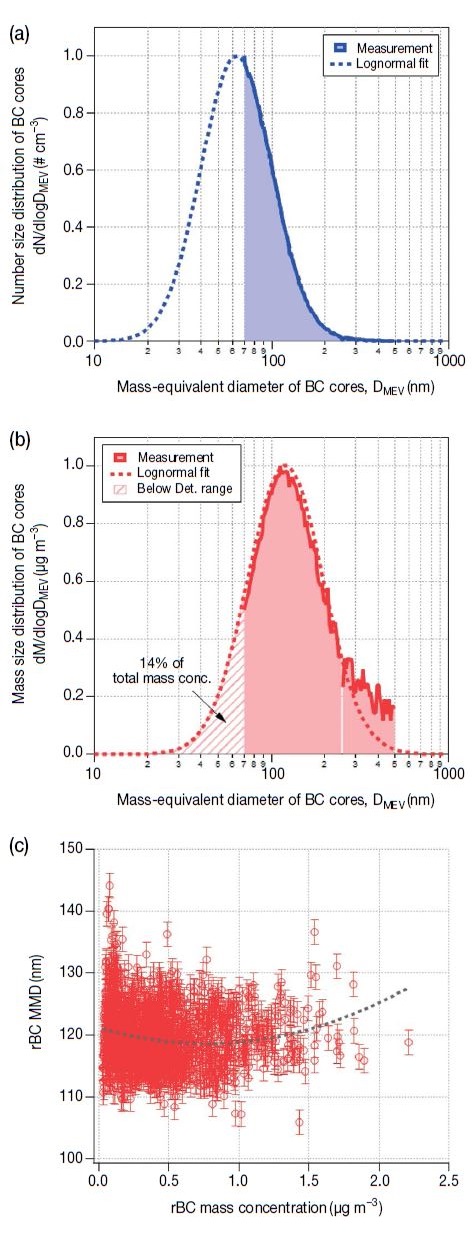
The size distributions of rBC particles. (a) Number size distribution, (b) Mass size distribution, and (c) A relationship between rBC mass concentration and MMD. In (a) and (b), the data on 5 August 2019 was used as an example.
그림 4b와 같이 때로는 큰 입경에서 단일 로그정규분포를 벗어나기도 했다. 그러나, 추가적인 외삽법을 수행할 경우, 500 nm에서의 SP2 검파기의 포화 (satu-ration)와 큰 입자의 일정치 않은 포집율로 인해 큰 불확도가 발생할 수 있다. 따라서 본 연구에서는 외삽법을 사용하지 않고 SP2 측정범위에서의 rBC 질량농도만을 다루었으며, 측정 입경범위로 인하여 발생할 수 있는 rBC와 EC 질량농도 차이를 후에 논의하였다.
BC의 10~50 nm 소구체들 (spherules)은 배출된 즉시 집합체 (aggregates)를 형성하는데, 배출원에 따라 입경이 다르다. 대기 중에서 노화되면서 집합체는 점차 꽉 찬 (compacted) 형태를 띠며 입경이 커진다 (Andreae and Gelencsér, 2006; Wentzel et al., 2003). 선행연구에 따르면 도심과 교외지역 rBC 입경분포는 유의미하게 다르다. 대체로 도심지 rBC MMD는 200 nm 이하, 교외지역 MMD는 200 nm 근처에서 나타난다 (Liu et al., 2019; McMeeking et al., 2010; Schwarz et al., 2008). 이러한 MMD에서의 차이는 rBC 주요 배출원과 대기 중 노화 정도 차이와 관련된다. 예를 들어, 주로 도심 fresh 자동차 이동오염원에서 배출된 미국 캘리포니아 로스앤젤레스 도심의 rBC MMD는 122 nm였다 (Metcalf et al., 2012). 반면, 식생연소에서 배출된 미국 텍사스의 rBC MMD는 210 nm, 시베리아, 중앙아시아 식생연소로 배출되어 장거리수송된 rBC MMD는 207 nm였다 (Kondo et al., 2011). 한편, 2016 KORUS-AQ 캠페인 기간 제주 고산 (Gosan Climate Observatory, GCO)에서 측정한 rBC MMD는 플룸 종류에 상관없이 190~220 nm로 도심지역 rBC MMD보다 확연히 컸다. 즉, 대체로 자동차 배출보다 식생연소에서 배출된 rBC는 입경이 크고, 대기 중에서 노화될수록 입경이 커지는 경향성이 있다. 따라서, 본 연구에서 측정한 서울의 여름철 rBC 입경분포 (평균 MMD 119±5 nm)는 도심 자동차 내연기관으로부터 배출된 fresh BC의 특성을 분명히 보여준다.
서울의 rBC MMD는 106~144 nm 범위를 보였다. rBC 질량농도 1.0 µg m-3 이하에서는 rBC MMD가 평균적으로 120 nm였으나, 1.0 µg m-3 이상에서는 rBC MMD가 130 nm까지 증가하는 경향을 보였다 (그림 4c). 이렇게 상대적으로 높은 rBC 질량농도에서 MMD가 증가하는 경향은 rBC 입자간 응집 (coagulation)의 가능성 혹은 배출원의 변화를 지시한다. 특히, rBC 질량농도 1.0 µg m-3 이상에서 rBC MMD가 상대적으로 작은 변동폭을 보이면서 증가하였는데, 이는 입경이 큰 rBC가 배출되는 오염원의 영향으로 판단된다.
3. 3 rBC 일변화와 EC와의 비교
전 측정기간에 걸쳐 rBC 질량농도는 EC 질량농도와 매우 좋은 상관성을 보였다 (r2=0.85; 그림 5). PM2.5가 10 µg m-3 미만에서 40 µg m-3 이상까지 변화한 전 측정기간에 10분 평균 rBC 농도를 EC의 시료포집 시간 (매 시 00분~45분)에 맞추었다. rBC에 대한 EC 기울기는 1.35±0.04로 EC가 rBC에 비하여 35% 높은 질량농도를 나타내었다.
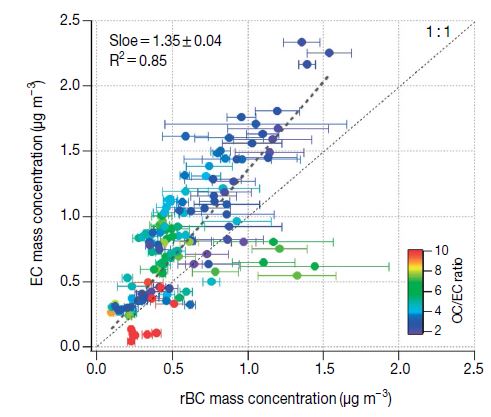
The relationship of rBC and EC mass concentrations. The data is color coded by OC/EC ratio, and the error bar stands for a standard deviation of rBC mass concentrations.
rBC와 EC 질량농도의 차이를 야기한 원인을 통해 여름철 서울 BC의 물리 화학적 특성과 배출원 특성을 이해하고자 rBC, EC, OC의 일변화를 살펴보았다 (그림 6). rBC와 EC 농도는 오전 6시에 증가하여 정오부터 감소하는 경향을 보였는데, 이는 바람장 변화에 따른 것이다. 오전 시간에는 동풍이 우세하다가 약 정오부터 주풍향이 서풍으로 변화하고 풍속이 빨라졌다. 측정지점으로부터 북동방향으로 2.3 km에 북부간선도로, 내부순환로가 위치하므로 출근시간 자동차 배출 증가에 의하여 rBC와 EC 농도가 동시에 증가한 것으로 판단된다. 반면, 서풍이 우세한 오후에는 일차적으로는 대기경계층 (planetary boundary layer, PBL) 확장에 의한 희석효과와 9 km 직선거리의 북한산 국립공원의 영향으로 rBC와 EC 농도가 감소한 것으로 판단된다. 구체적으로, 일 최대풍속의 서풍 계열의 영향을 받는 오후 3시~7시에 rBC와 EC 농도 감소가 지속되었고, 오후 8시 이후부터 낮고 안정적인 대기경계층의 효과로 농도가 조금 높아졌다. 반면, OC 농도는 오전 10시~오후 4시 사이에 가장 높아 일사량 변화와 일치하였다. 이러한 OC 농도 일변화는 국지적 광화학반응으로 인한 에어로졸 이차생성과 밀접한 관련이 있다고 판단된다 (Kim et al., 2018; Kroll and Seinfeld, 2008).
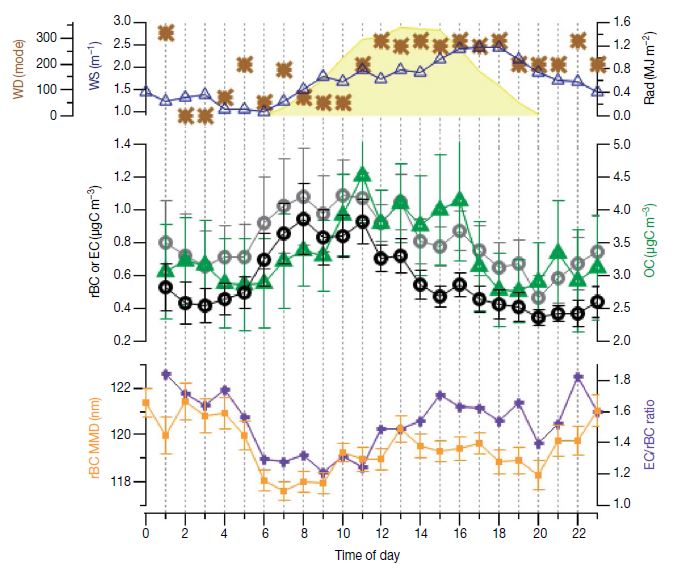
Diurnal variations of meteorological parameters (wind direction and radiation), mass concentrations of rBC, EC, and OC, rBC MMD, and EC/rBC ratio. The “WD (mode)” indicates most frequently occurred wind direction every hour.
흥미롭게도 EC/rBC 비는 rBC, EC 고농도가 나타난 오전 시간에 가장 작았고 rBC MMD 일변화와 거의 일치하였다. 즉, 자동차 배출의 영향이 가장 큰 오전 시간에 BC 농도가 가장 높고, 입경은 작았으며 EC/rBC 비도 작았다. 반면 BC 농도가 낮은 오후~밤 시간에 상대적으로 EC/rBC 비와 rBC MMD가 모두 증가하였다. 즉, 상대적으로 큰 BC 입자가 많아질 때, 두 측정방법의 상이한 측정 입경범위로 인하여 EC와 rBC 질량농도의 차이는 더욱 커졌다. 일부 선행연구들은 EC를 배출원에 따라 char-EC와 soot-EC로 구분하기도 하는데, 주로 char-EC는 상대적으로 입경이 크고 soot-EC는 입경이 작고 내화성이 크다 (Lim et al., 2012; Han et al., 2010, 2007). 본 실험에서도 이와 유사하게 자동차 배출의 경우 입경이 작고, 자동차 배출의 영향이 감소하면서 입경이 커졌다. 또한, 자동차 배출의 경우 내화성이 큰 soot-EC의 영향으로 EC/rBC 비가 1에 가까워진 것으로 판단된다.
반면, EC 농도가 1 µg m-3 미만일 때, rBC 농도가 더 높아 1 : 1 라인 우측으로 기울어지는 경우가 있었고 (그림 5), 이때 OC/EC 비는 5 이상이었다. EC는 저농도대에서 최대 측정 불확도가 80%까지 증가할 수 있다 (Sharma et al., 2017). 따라서 이와 같이 rBC보다 낮은 저농도의 EC는 OC, EC 분리시 불확도가 커진 결과일 것이다. 결론적으로, rBC와 EC의 질량농도 차이는 상이한 측정 입경범위, 내화성 정도, 측정 불확도 때문이었고, 특히 앞의 두 가지는 배출원 변화에 따른 결과로 판단된다.
결과적으로, 정밀교정을 바탕으로 신뢰도가 검증될 경우, SP2를 이용한 rBC 측정은 정확하고 정밀한 BC 농도와 입경분포 산출이 가능하고, 이러한 rBC 특성은 BC의 배출원 구분에 유용하게 사용될 것이라 기대된다.
4. 결 론
서울 여름철 BC의 배출원 및 대기 중 노화정도를 이해하고자 2019년 7월 29일부터 8월 9일까지 서울 성북구 안암동 고려대학교에서 SP를 이용하여 rBC를 측정하였다. 이에 앞서 SP2의 교정시스템을 구축하였고, 신뢰도 높은 정밀교정을 수행하였다.
측정기간 rBC 평균 질량농도와 수농도는 각각 0.58 ±0.32 µg m-3와 336±190 # cm-3이었다. rBC의 입경분포 (MMD 119±5 nm)는 도심에서 측정한 선행연구 결과와 비슷하였다. 일변화에서 rBC와 EC는 오전시간에 상대적으로 고농도, MMD 감소, EC/rBC 비 감소가 나타났는데, 이 결과는 BC가 외부유입보다는 도심 국지적 자동차 이동오염원의 영향을 크게 받았음을 지시한다. 한편, rBC 질량농도가 1.0 µg m-3 이상으로 증가하면서 MMD가 작은 변동폭을 보이면서 증가하였는데, 이는 입경이 큰 rBC가 배출되는 오염원의 영향으로 판단된다. 비교측정기간 EC의 질량농도는 rBC보다 35% 높았고 이러한 rBC와 EC의 질량농도 차이는 상이한 측정 입경범위, 내화성 정도, 측정 불확도에 의해 야기되었다고 판단된다. 특히, 앞의 두 가지는 배출원 변화에 따른 결과일 것이다.
결과적으로, 정밀교정 바탕으로 신뢰도 검증될 경우, SP2로 측정한 rBC는 정확, 정밀한 BC 농도와 입경분포 산출이 가능하고, 이를 통하여 배출원 구분이 가능할 것이다. 특히, BC의 배출지역 (국지배출 vs. 외부유입)과 특정 배출원별 구분에 유용할 것이다.
Acknowledgments
이 연구는 기상청 국립기상과학원 「기상항공기 활용기술개발연구」 (1365003069)의 지원으로 수행되었습니다.
References
-
Andreae, M.O., Gelencsér, A. (2006) Black carbon or brown carbon? The nature of light-absorbing carbonaceous aerosols, Atmospheric Chemistry and Physics, 6(10), 3131-3148.
[https://doi.org/10.5194/acp-6-3131-2006]

-
Bond, T.C., Doherty, S.J., Fahey, D.W., Forster, P.M., Berntsen, T., DeAngelo, B.J., Flanner, M.G., Ghan, S., Kärcher, B., Koch, D., Kinne, S., Kondo, Y., Quinn, P.K., Sarofim, M.C., Schultz, M.G., Schulz, M., Venkataraman, C., Zhang, H., Zhang, S., Bellouin, N., Guttikunda, S.K., Hopke, P.K., Jacobson, M.Z., Kaiser, J.W., Klimont, Z., Lohmann, U., Schwarz, J.P., Shindell, D., Storelvmo, T., Warren, S.G., Zender, C.S. (2013) Bounding the role of black carbon in the climate system: A scientific assessment, Journal of Geophysical Research: Atmospheres, 118(11), 5380-5552.
[https://doi.org/10.1002/jgrd.50171]

- Boucher, O., Randall, D., Artaxo, P., Bretherton, C., Feingold, G., Forster, P., Kerminen, V.-M., Kondo, Y., Liao, H., Lohmann, U., Rasch, P., Satheesh, S.K., Sherwood, S., Stevens, B., Zhang, X.Y. (2013) Clouds and Aerosols. Climate Change 2013: The Physical Science Basis, Edited by T. F. Stocker et al., Cambridge University Press, 571-657.
-
Chung, S.H., Seinfeld, J.H. (2005) Climate response of direct radiative forcing of anthropogenic black carbon, Journal of Geophysical Research, 110(D11), D11102.
[https://doi.org/10.1029/2004JD005441]

-
Ding, A.J., Huang, X., Nie, W., Sun, J.N., Kerminen, V.-M., Petäjä, T., Su, H., Cheng, Y.F., Yang, X.-Q., Wang, M.H., Chi, X.G., Wang, J.P., Virkkula, A., Guo, W.D., Yuan, J., Wang, S.Y., Zhang, R.J., Wu, Y.F., Song, Y., Zhu, T., Zilitinkevich, S., Kulmala, M., Fu, C.B. (2016) Enhanced haze pollution by black carbon in megacities in China, Geophysical Research Letters, 43(6), 2873-2879.
[https://doi.org/10.1002/2016GL067745]

-
Gysel, M., Laborde, M., Olfert, J.S., Subramanian, R., Gröhn, A.J. (2011) Effective density of Aquadag and fullerene soot black carbon reference materials used for SP2 calibration, Atmospheric Measurement Techniques, 4(12), 2851-2858.
[https://doi.org/10.5194/amt-4-2851-2011]

-
Han, Y., Cao, J., Chow, J.C., Watson, J.G., An, Z., Jin, Z., Fung, K., Liu, S. (2007) Evaluation of the thermal/optical reflectance method for discrimination between char- and soot-EC, Chemosphere, 69(4), 569-574.
[https://doi.org/10.1016/j.chemosphere.2007.03.024]

-
Han, Y.M., Cao, J.J., Lee, S.C., Ho, K.F., An, Z.S. (2010) Different characteristics of char and soot in the atmosphere and their ratio as an indicator for source identification in Xi’an, China, Atmospheric Chemistry and Physics, 10(2), 595-607.
[https://doi.org/10.5194/acp-10-595-2010]

-
Hwang, I., Ahn, K.-H. (2017) Performance evaluation of conventional type conductive cooling continuous flow compact water-based CPC (Hy-WCPC), Journal of Aerosol Science, 113, 12-19.
[https://doi.org/10.1016/j.jaerosci.2017.07.007]

- Janssen, N.A.H., Gerlofs-Nijland, M.E., Lanki, T., Salonen, R.O., Cassee, F., Hoek, G. (2012) Heath effects of black carbon, Copenhagen, Denmark.
-
Janssen, N.A.H., Hoek, G., Simic-Lawson, M., Fischer, P., van Bree, L., ten Brink, H., Keuken, M., Atkinson, R.W., Anderson, H.R., Brunekreef, B., Cassee, F.R. (2011) Black carbon as an additional indicator of the adverse health effects of airborne particles compared with PM10 and PM2.5, Environmental Health Perspectives, 119(12), 1691-1699.
[https://doi.org/10.1289/ehp.1003369]

-
Kim, H., Zhang, Q., Heo, J. (2018) Influence of intense secondary aerosol formation and long-range transport on aerosol chemistry and properties in the Seoul Metropolitan Area during spring time: results from KORUS-AQ, Atmospheric Chemistry and Physics, 18(10), 7149- 7168.
[https://doi.org/10.5194/acp-18-7149-2018]

-
Kiselev, A., Wennrich, C., Stratmann, F., Wex, H., Henning, S., Mentel, T.F., Kiendler-Scharr, A., Schneider, J., Walter, S., Lieberwirth, I. (2010) Morphological characterization of soot aerosol particles during LACIS Experiment in November (LExNo), Journal of Geophysical Research, 115(D11), D11204.
[https://doi.org/10.1029/2009JD012635]

-
Kondo, Y., Matsui, H., Moteki, N., Sahu, L., Takegawa, N., Kajino, M., Zhao, Y., Cubison, M.J., Jimenez, J.L., Vay, S., Diskin, G.S., Anderson, B., Wisthaler, A., Mikoviny, T., Fuelberg, H.E., Blake, D.R., Huey, G., Weinheimer, A.J., Knapp, D.J., Brune, W.H. (2011) Emissions of black carbon, organic, and inorganic aerosols from biomass burning in North America and Asia in 2008, Journal of Geophysical Research, 116(D8), D08204.
[https://doi.org/10.1029/2010JD015152]

-
Kroll, J.H., Seinfeld, J.H. (2008) Chemistry of secondary organic aerosol: Formation and evolution of low-volatility organics in the atmosphere, Atmospheric Environment, 42(16), 3593-3624.
[https://doi.org/10.1016/j.atmosenv.2008.01.003]

-
Laborde, M., Schnaiter, M., Linke, C., Saathoff, H., Naumann, K.-H., Möhler, O., Berlenz, S., Wagner, U., Taylor, J.W., Liu, D., Flynn, M., Allan, J.D., Coe, H., Heimerl, K., Dahlkötter, F., Weinzierl, B., Wollny, A.G., Zanatta, M., Cozic, J., Laj, P., Hitzenberger, R., Schwarz, J.P., Gysel, M. (2012) Single particle soot photometer intercomparison at the AIDA chamber, Atmospheric Measurement Techniques, 5, 3077-3097.
[https://doi.org/10.5194/amt-5-3077-2012]

-
Lee, G.H., Ahn, K.-H., Yu, I.J. (2016) Testing of nanoparticle release from a composite containing nanomaterial using a chamber system, Journal of Visualized Experiments, 117, e54449.
[https://doi.org/10.3791/54449]

-
Lee, J. (2018). Corrections and artifacts regarding filter-based measurements of black carbon, Journal of Korean Society for Atmospheric Environment, 34(4), 610-615, (in Korean with English abstract).
[https://doi.org/10.5572/KOSAE.2018.34.4.610]

-
Lim, S., Faïn, X., Zanatta, M., Cozic, J., Jaffrezo, J.-L., Ginot, P., Laj, P. (2014) Refractory black carbon mass concentrations in snow and ice: method evaluation and intercomparison with elemental carbon measurement, Atmospheric Measurement Techniques, 7(10), 3307-3324.
[https://doi.org/10.5194/amt-7-3307-2014]

-
Lim, S., Lee, M., Lee, G., Kim, S., Yoon, S., Kang, K. (2012) Ionic and carbonaceous compositions of PM10, PM2.5 and PM1.0 at Gosan ABC Superstation and their ratios as source signature, Atmospheric Chemistry and Physics, 12(4), 2007-2024.
[https://doi.org/10.5194/acp-12-2007-2012]

-
Lim, S., Faïn, X., Ginot, P., Mikhalenko, V., Kutuzov, S., Paris, J.-D., Kozachek, A., Laj, P. (2017) Black carbon variability since preindustrial times in the eastern part of Europe reconstructed from Mt. Elbrus, Caucasus, ice cores, Atmospheric Chemistry and Physics, 17(5), 3489- 3505.
[https://doi.org/10.5194/acp-17-3489-2017]

-
Liu, D., Joshi, R., Wang, J., Yu, C., Allan, J.D., Coe, H., Flynn, M.J., Xie, C., Lee, J., Squires, F., Kotthaus, S., Grimmond, S., Ge, X., Sun, Y., Fu, P. (2018) Contrasting physical properties of black carbon in urban Beijing between winter and summer, Atmospheric Chemistry and Physics Discussions, 1-30.
[https://doi.org/10.5194/acp-2018-1142-supplement]

-
Liu, H., Pan, X., Liu, D., Liu, X., Chen, X., Tian, Y., Sun, Y., Fu, P., Wang, Z. (2019) Mixing characteristics of refractory black carbon aerosols determined by a tandem CPMA-SP2 system at an urban site in Beijing, Atmospheric Chemistry and Physics Discussions, 1-25.
[https://doi.org/10.5194/acp-2019-244-supplement]

-
Lou, S., Yang, Y., Wang, H., Smith, S.J., Qian, Y., Rasch, P.J. (2019) Black carbon amplifies haze over the North China Plain by weakening the east asian winter monsoon, Geophysical Research Letters, 46(1), 452-460.
[https://doi.org/10.1029/2018GL080941]

-
McMeeking, G.R., Hamburger, T., Liu, D., Flynn, M., Morgan, W.T., Northway, M., Highwood, E.J., Krejci, R., Allan, J.D., Minikin, A., Coe, H. (2010) Black carbon measurements in the boundary layer over western and northern Europe, Atmospheric Chemistry and Physics, 10(19), 9393-9414.
[https://doi.org/10.5194/acp-10-9393-2010]

-
Metcalf, A.R., Craven, J.S., Ensberg, J.J., Brioude, J., Angevine, W., Sorooshian, A., Duong, H.T., Jonsson, H.H., Flagan, R.C., Seinfeld, J.H. (2012) Black carbon aerosol over the Los Angeles Basin during CalNex, Journal of Geophysical Research: Atmospheres, 117(D21), n/a-n/a.
[https://doi.org/10.1029/2011JD017255]

-
Miyakawa, T., Kanaya, Y., Komazaki, Y., Taketani, F., Pan, X., Irwin, M., Symonds, J. (2016) Intercomparison between a single particle soot photometer and evolved gas analysis in an industrial area in Japan: Implications for the consistency of soot aerosol mass concentration measurements, Atmospheric Environment, 127, 14-21.
[https://doi.org/10.1016/j.atmosenv.2015.12.018]

-
Moteki, N., Kondo, Y. (2010) Dependence of laser-induced incandescence on physical properties of black carbon aerosols: measurements and theoretical interpretation, Aerosol Science and Technology, 44(8), 663-675.
[https://doi.org/10.1080/02786826.2010.484450]

-
Ni, M., Huang, J., Lu, S., Li, X., Yan, J., Cen, K. (2014) A review on black carbon emissions, worldwide and in China, Chemosphere, 107, 83-93.
[https://doi.org/10.1016/j.chemosphere.2014.02.052]

-
Oh, J., Park, J., Lee, S., Ahn, J., Choi, J., Lee, S., Lee, Y., Kim, H., Hong, Y., Hong, J., Kim, J., Kim, S., Lee, G. (2015) Characteristics of black carbon particles in ambient air using a single particle soot photometer (SP2) in May 2013, Jeju, Korea, Journal of Korean Society for Atmospheric Environment, 31(3), 255-268, (in Korean with English abstract).
[https://doi.org/10.5572/KOSAE.2015.31.3.255]

-
Ohata, S., Moteki, N., Mori, T., Koike, M., Kondo, Y. (2016) A key process controlling the wet removal of aerosols: new observational evidence, Scientific Reports, 6(1), 34113.
[https://doi.org/10.1038/srep34113]

-
Panteliadis, P., Hafkenscheid, T., Cary, B., Diapouli, E., Fischer, A., Favez, O., Quincey, P., Viana, M., Hitzenberger, R., Vecchi, R., Saraga, D., Sciare, J., Jaffrezo, J.L., John, A., Schwarz, J., Giannoni, M., Novak, J., Karanasiou, A., Fermo, P., Maenhaut, W. (2015) ECOC comparison exercise with identical thermal protocols after temperature offset correction-instrument diagnostics by in-depth evaluation of operational parameters, Atmospheric Measurement Techniques, 8(2), 779-792.
[https://doi.org/10.5194/amt-8-779-2015]

- Park, J., Song, I., Kim, H., Lim, H., Park, S., Shin, S., Shin, H., Lee, S., Kim, J. (2019) The characteristics of black carbon of Seoul, Journal of Environment Impact Assessment, 28(2), 113-128, (in Korean with English abstract).
-
Schmid, O., Artaxo, P., Arnott, W.P., Chand, D., Gatti, L.V., Frank, G.P., Hoffer, A., Schnaiter, M., Andreae, M.O. (2006) Spectral light absorption by ambient aerosols influenced by biomass burning in the Amazon Basin. I: Comparison and field calibration of absorption measurement techniques, Atmospheric Chemistry and Physics, 6(11), 3443-3462.
[https://doi.org/10.5194/acp-6-3443-2006]

-
Schwarz, J.P., Gao, R.S., Fahey, D.W., Thomson, D.S., Watts, L.a., Wilson, J.C., Reeves, J.M., Darbeheshti, M., Baumgardner, D.G., Kok, G.L., Chung, S.H., Schulz, M., Hendricks, J., Lauer, a., Kärcher, B., Slowik, J.G., Rosenlof, K.H., Thompson, T.L., Langford, a.O., Loewenstein, M., Aikin, K.C. (2006) Single-particle measurements of midlatitude black carbon and light-scattering aerosols from the boundary layer to the lower stratosphere, Journal of Geophysical Research, 111(D16), D16207.
[https://doi.org/10.1029/2006JD007076]

-
Schwarz, J.P., Gao, R.S., Spackman, J.R., Watts, L.A., Thomson, D.S., Fahey, D.W., Ryerson, T.B., Peischl, J., Holloway, J.S., Trainer, M., Frost, G.J., Baynard, T., Lack, D.A., de Gouw, J.A., Warneke, C., Del Negro, L.A. (2008) Measurement of the mixing state, mass, and optical size of individual black carbon particles in urban and biomass burning emissions, Geophysical Research Letters, 35(13), L13810.
[https://doi.org/10.1029/2008GL033968]

-
Schwarz, J.P., Spackman, J.R., Gao, R.S., Perring, a.E., Cross, E., Onasch, T.B., Ahern, a., Wrobel, W., Davidovits, P., Olfert, J., Dubey, M.K., Mazzoleni, C., Fahey, D.W. (2010) The detection efficiency of the single particle soot photometer, Aerosol Science and Technology, 44(8), 612-628.
[https://doi.org/10.1080/02786826.2010.481298]

-
Sharma, S., Richard Leaitch, W., Huang, L., Veber, D., Kolonjari, F., Zhang, W., Hanna, S.J., Bertram, A.K., Ogren, J.A. (2017) An evaluation of three methods for measuring black carbon in Alert, Canada, Atmospheric Chemistry and Physics, 17(24), 15225-15243.
[https://doi.org/10.5194/acp-17-15225-2017]

-
Stephens, M., Turner, N., Sandberg, J. (2003). Particle identification by laser-induced incandescence in a solid-state laser cavity, Applied Optics, 42(19), 3726-3736.
[https://doi.org/10.1364/AO.42.003726]

-
Wang, Q., Huang, R.-J., Cao, J., Tie, X., Shen, Z., Zhao, S., Han, Y., Li, G., Li, Z., Ni, H., Zhou, Y., Wang, M., Chen, Y., Su, X. (2016) Contribution of regional transport to the black carbon aerosol during winter haze period in Beijing, Atmospheric Environment, 132, 11-18.
[https://doi.org/10.1016/j.atmosenv.2016.02.031]

-
Wang, Q., Schwarz, J.P., Cao, J., Gao, R., Fahey, D.W., Hu, T., Huang, R.-J., Han, Y., Shen, Z. (2014) Black carbon aerosol characterization in a remote area of Qinghai-Tibetan Plateau, western China, Science of The Total Environment, 479-480, 151-158.
[https://doi.org/10.1016/j.scitotenv.2014.01.098]

-
Wang, Q.Y., Huang, R.-J., Cao, J.J., Tie, X.X., Ni, H.Y., Zhou, Y.Q., Han, Y.M., Hu, T.F., Zhu, C.S., Feng, T., Li, N., Li, J.D. (2015) Black carbon aerosol in winter northeastern Qinghai-Tibetan Plateau, China: the source, mixing state and optical property, Atmospheric Chemistry and Physics, 15(22), 13059-13069.
[https://doi.org/10.5194/acp-15-13059-2015]

-
Wang, R., Tao, S., Wang, W., Liu, J., Shen, H., Shen, G., Wang, B., Liu, X., Li, W., Huang, Y., Zhang, Y., Lu, Y., Chen, H., Chen, Y., Wang, C., Zhu, D., Wang, X., Li, B., Liu, W., Ma, J. (2012) Black carbon emissions in China from 1949 to 2050, Environmental Science & Technology, 46(14), 7595-7603.
[https://doi.org/10.1021/es3003684]

-
Weingartner, E., Saathoff, H., Schnaiter, M., Streit, N., Bitnar, B., Baltensperger, U. (2003) Absorption of light by soot particles: determination of the absorption coefficient by means of aethalometers, Journal of Aerosol Science, 34(10), 1445-1463.
[https://doi.org/10.1016/S0021-8502(03)00359-8]

-
Wentzel, M., Gorzawski, H., Naumann, K.-H., Saathoff, H., Weinbruch, S. (2003) Transmission electron microscopical and aerosol dynamical characterization of soot aerosols, Journal of Aerosol Science, 34(10), 1347-1370.
[https://doi.org/10.1016/S0021-8502(03)00360-4]

-
Wu, Y., Zhang, R., Tian, P., Tao, J., Hsu, S.C., Yan, P., Wang, Q., Cao, J., Zhang, X., Xia, X. (2016) Effect of ambient humidity on the light absorption amplification of black carbon in Beijing during January 2013, Atmospheric Environment, 124, 217-223.
[https://doi.org/10.1016/j.atmosenv.2015.04.041]

-
Zhang, R., Khalizov, A.F., Pagels, J., Zhang, D., Xue, H., McMurry, P.H. (2008) Variability in morphology, hygroscopicity, and optical properties of soot aerosols during atmospheric processing, Proceedings of the National Academy of Sciences, 105(30), 10291-10296.
[https://doi.org/10.1073/pnas.0804860105]

-
Zhou, C., Penner, J.E., Flanner, M.G., Bisiaux, M.M., Edwards, R., McConnell, J.R. (2012) Transport of black carbon to polar regions: Sensitivity and forcing by black carbon, Geophysical Research Letters, 39(22), L22804.
[https://doi.org/10.1029/2012GL053388]

임세희 (고려대학교 지구환경과학과 연구교수)
강유정 (고려대학교 지구환경과학과 석사과정 학생)
이미혜 (고려대학교 지구환경과학과 교수)
유희정 (국립기상과학원 환경기상연구과 연구사)
이상삼 (국립기상과학원 환경기상연구과 연구관)
이건호 (Particle Instrument and Engineering 대표)
