측정 방법에 따른 PM2.5 농도 비교
Copyright © 2017 Korean Society for Atmospheric Environment
Abstract
PM2.5 concentrations were measured using a cyclone, impactor (the U.S. Environmental Protection Agency well impactor ninety-six, WINS) and optical particle counter (OPC) at a campus site located in Yongin for the period August 2014 through March 2017. The concentrations from cyclone (Y) were generally higher than those from impactor (X); the best-fit line was Y=1.22X+5.64. The ratios of PM2.5/PM10 ranged from 0.61 to 0.66 when PM2.5 concentrations from cyclones in selected studies were converted into those from impactors using a regression equation in this study. The slope of the best-fit line between OPC and impactor was close to 1 at 0.95, while that between OPC and cyclone was 0.72. After sampling, the flow rate in the low-volume air sampler with cyclone decreased by 3% on average, which did not have a significant effect on measured concentrations.
Keywords:
Cyclone, Impactor, Optical particle counter, PM2.5/PM10, Flow rate1. 서 론
대부분의 지역에서 입자상 물질 (particulate matter, PM) 측정의 표준은 필터를 이용한 시료채취와 칭량 (weighing)으로 구성된 필터 측정이다 (ME, 2016; WHO, 2006; USEPA, 1997). 그러나 여기서 표준은 환경기준 준수를 판정하기 위한, 규제 관점의 표준 (regulatory standard)을 의미하기 때문에, 대기 중 실제 농도를 정확하게 알기 위한 과학적 관점의 표준과 다르다 (Solomon et al., 2008; NARSTO, 2004; McMurry, 2000). 이에 따라 반 (semi) 휘발성 물질에 의한 음 혹은 양의 오차에 취약하다거나 시료채취 시간이 길어 고해상도 시간 변화를 알기 어렵다는 등의 단점보다, 쉽게 활용이 가능하고 결과가 일관되며, 많은 자료가 축적되어 영향 평가가 용이하다는 등의 장점이 중요하다.
PM의 크기는 채취구의 입경분리에 좌우되는데, 싸이클론이나 임팩터를 이용하는 것이 보통이다 (NARSTO, 2004; McMurry, 2000; Chow, 1995). 우리나라 일반 연구자들은 싸이클론을 많이 이용하지만 (Bae et al., 2017; Lee et al., 2017; Kim and Hwang, 2016) 최근에는 임팩터 이용도 적지 않다 (Ko et al., 2016; Kim et al., 2015; Son et al., 2015). 우리나라 대기오염공정시험 기준에서 입경분리의 기준으로 USEPA (1997)을 인용함에 따라 (ME, 2016), 환경부 측정망의 PM2.5 필터 측정에서는 미국 EPA의 설계 목표에 따라 개발된 WINS (well impactor ninety-six; Peters et al., 2001)를 이용하며 (Jeon et al., 2015), 국가기준측정장비 선정을 위한 비교 측정에서도 채취구는 WINS였다 (Lee et al., 2015). 많은 측정과 기기들이 싸이클론 혹은 임팩터를 이용하고 있음에도 이들에 의한 측정 결과를 비교한 연구는 찾기 어렵다. 임팩터에 의한 입경분리가 이론적으로 예측이 가능하고 실제 측정 결과와도 잘 일치하는 데 비하여, 싸이클론은 내부 유동이 복잡하기 때문에 입경분리도 실험에 의하여 결정하는 것으로 알려져 있다 (Chow, 1995; Hering, 1995). 하지만, 싸이클론에서는 임팩터에서와 같이 입자가 튀어 기류를 따라가는 현상이 나타나지 않으며, 포집 면적이 넓고 걸러진 입자를 호퍼에 저장할 수 있어 상대적으로 많은 양의 입자를 측정할 수 있다는 장점이 있다.
입자에 의한 빛의 산란을 이용하여 질량농도를 측정하는 방법은 빠르고, 간편하며, 관리가 용이한 까닭에 국내에서도 이용이 늘고 있다 (Lee et al., 2016; Song et al., 2015; Yu et al., 2015). 이들 중 Grimm사의 EDM (Environmental Dust Monitor) 180은 2011년 미국 EPA에서 FEM (federal equivalent method)으로 승인되었다 (USEPA, 2016). 경기도 용인에 위치한 한국외국어대학교 글로벌캠퍼스에서는 2014년 8월부터 2017년 3월까지 PM2.5 농도를, 싸이클론 혹은 임팩터를 이용하여 필터로 측정하거나, 광학입자계수기 (optical particle counter, OPC)를 이용하여 측정하였다. PM의 측정에서는 표준물질이 주어지지 않으므로 이번 연구에서는 이들의 측정 결과를 비교함으로써 상관성과 차이를 조사하였다.
2. 방 법
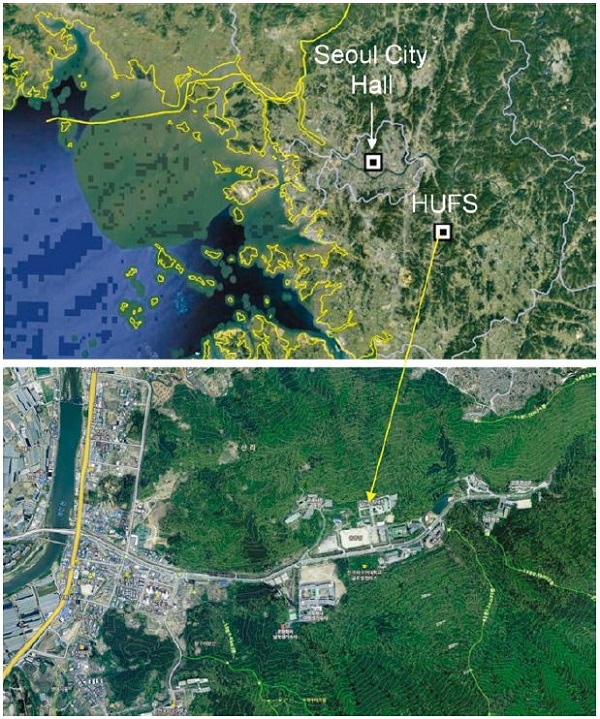
측정지점은 한국외국어대학교 글로벌캠퍼스 내 5층 건물인 자연과학대학 옥상 (127.27°E, 37.34°N, 해발고도 167 m)으로, 서울 시청으로부터 주풍인 편서풍의 풍하 방향인 남동쪽으로 약 35 km 거리에 있다 (그림 1). 동쪽이 산지인 동 - 서 방향 계곡에 위치하고 있으며, 서쪽으로는 4차선 국도와 하천 주변에 소규모 건물과 농경지, 나대지가 분포된 전원 지역이다.

Location of the measurement site in the Global Campus of Hankuk University of Foreign Studies (HUFS).
싸이클론 (URG-2000-30EH)을 1단 테플론 필터팩에 연결한 저용량 공기채취기와, 임팩터로 WINS를 장착한 3단 연속채취기 (PMS-111)를 이용하여 각각 직경 47 mm 테플론 필터 (Zeflour, Pall)에 PM2.5 시료를 24시간 채취하였다. 시료채취 전, 후 필터는 데시케이터에서 24시간 항량 후 전자저울 (Ohaus DVG215CD)을 이용하여 0.01 mg까지 칭량하였다. 유량은 16.7 L/min인데, 임팩터를 장착한 연속채취기의 유량은 질량유량계로 실시간 측정하며 일정하게 유지된다. 싸이클론을 장착한 저용량 채취기의 유량은 시료채취 전 질량유량계 (TSI 4143)와 차압계를 이용하여 16.7 L/min을 맞추었고, 시료채취 후에 측정하여 변화를 조사하였다.
OPC는 레이저 광선의 산란으로부터 입경별 입자수를 측정한 후 고유의 도시입자 입경분포 자료를 이용하여 입경별 질량농도로 환산한다 (Burkart et al., 2010; Grimm and Eatough, 2009). 이번 연구의 OPC Grimm 1.109는 광학상당 (optical equivalent) 입경 0.25~32 μm 범위 입자를 31개 채널로 나누어 측정하며 유량은 1.2 L/min이다.
3. 결 과
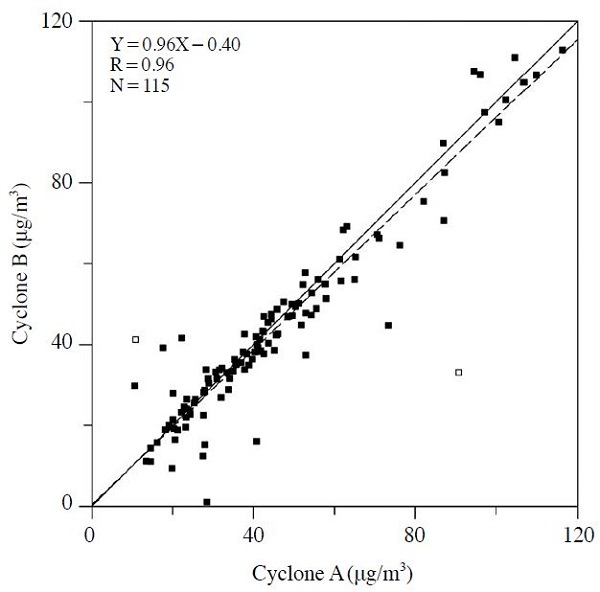
측정기간 중 55일은 싸이클론 A로 24시간 PM2.5 시료를 채취하였으며, 117일은 싸이클론 A와 B로 동시에 시료를 채취하였다. 싸이클론 A와 B로 측정한 농도는 상관계수 0.93, 최적 합치선의 기울기는 0.91이었다. 싸이클론 A와 B로 측정한 농도의 평균은 통계적으로 다르지 않았지만 (t-test, p=0.591), 일부 자료는 둘의 차이가 컸다 (그림 2). 이에 따라 차이의 평균과 표준편차를 조사하여 평균보다 표준편차 3배 이상 크거나 작은 것은 같은 장소 (collocated) 측정의 범위를 벗어난 것으로 보아 2개 자료를 삭제하였다. 그 결과, 상관계수와 기울기가 0.96으로 높아졌으며, 절편도 2.54 μg/m3에서 -0.40 μg/m3로 감소하였다.

Correlation between concentrations measured using cyclones A and B. Solid line denotes the 1 : 1 line. Dashed line denotes the best-fit line, for which open symbols were excluded because the differences in concentration between cyclones A and B were considered too large for collocated sampling. The equation for the best-fit line is provided in the upper-right corner, together with the correlation coefficient (R) and number of data (N) for solid symbols.
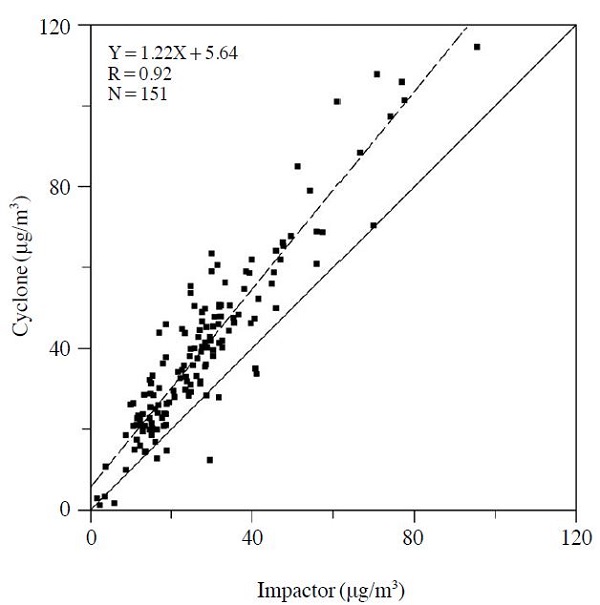
그림 3은 임팩터로 WINS를 장착한 3단 연속채취기와 싸이클론을 장착한 저용량 채취기로 측정한 농도의 상관성을 조사한 것이다. 싸이클론의 경우, A 자료가 있을 때는 A 자료를, A, B 모두 자료가 있을 때는 두 자료의 평균을 이용하였다. 이때 그림 2에서 A, B의 차이가 큰 자료는 측정이 정상적이지 않은 것으로 판단하여 이용하지 않았다. 싸이클론과 임팩터의 상관계수는 0.92로 높았지만 최적 합치선의 기울기가 1.22로 컸고 절편도 작지 않았다.

Correlation between concentrations measured using cyclone and impactor. Solid and dashed lines denote the 1 : 1 and best fit lines, respectively.
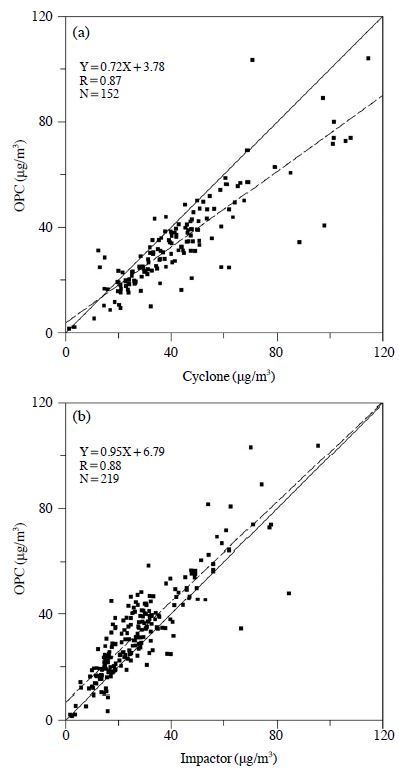
그림 4(a), (b)는 각각 OPC와 싸이클론, OPC와 임팩터의 상관성을 조사한 것이다. 상관계수는 (a), (b)가 거의 같으나, 기울기는 OPC - 싸이클론이 0.72로 1보다 작은 반면, OPC - 임팩터는 0.95로 1에 가까웠다. 이와 같은 결과는 일부 예상할 수 있었는데, 미국 EPA에서 FEM으로 승인된 EDM 180이 이번 연구의 OPC Grimm 1.109를 토대로 하였고 (Burkart et al., 2010), 이는 OPC PM2.5가 WINS PM2.5에 상응함을 의미하였기 때문이다. 그러나 그림 3에서 싸이클론의 농도가 임팩터보다 높고 그림 4(b)에서 OPC과 임팩터의 농도가 유사한 까닭에, 그림 4(a)에서 싸이클론의 농도는 OPC보다 높고 그만큼 기울기가 낮았다.
4. 검 토
싸이클론의 농도가 임팩터 혹은 OPC보다 높은 이유로는, 1차로 유량을 의심할 수 있다. 임팩터가 장착된 PMS-111은 유량을 실시간으로 측정하며 맞춘 데 비하여, 싸이클론을 장착한 저용량 채취기는 시료채취 전에 유량을 맞춘 후 시료채취 후 유량 변화만을 조사하였기 때문이다. 유량은 시료가 포집되며 압력손실이 증가하면 감소할 수 있다. 이번 연구에서는 시료채취 후 유량이 16.2±1.0 L/min로 평균 3% 감소하였으나 유량 변화와 시료 무게는 상관계수가 0.0으로 상관성이 없었다. 유량 감소의 원인은 분명하지 않지만 유량이 감소하면 (1) 싸이클론의 분리 입경이 커져 포집량이 증가할 수 있고, (2) 시료채취 과정의 공기량이 줄게 되므로 농도가 증가된다. 그러나 URG에서 제공하는 자료에 의하면 유량 감소에 의한 분리입경은 약 2.6 μm로, 차이가 0.1 μm에 불과하다 (http://www.urgcorp.com/index.php/products/inlets/teflon-coated-aluminum-cyclones/33-configurations/153-urg-2000-30eh). (2)의 경우, 그림 2~4의 싸이클론 농도는 유량 16.7 L/min을 가정하여 계산하였지만, 최종 유량과 평균값을 이용하면 농도는 평균 42.7 μg/m3에서 43.6 μg/m3로 2% 높아진다.
싸이클론의 농도가 높은 원인으로 유량을 의심하였지만 분리입경 상승의 효과는 미미하고, 유량 감소 효과를 고려하면 임팩터와 농도 차이는 더욱 증가하였다. 싸이클론과 임팩터의 농도 차이는 통계적으로도 명확한 만큼 (p=0) 그동안 논란이 된 PM2.5/PM10 비를 다시 한 번 살펴보았다. 싸이클론을 이용하여 수도권에서 PM을 측정한 Ghim and Kim (2004)과 Won et al. (2010)에서 PM2.5/PM10 비가 각각 0.85와 0.87~0.94였으며, PM10은 85.2 μg/m3와 41.5~49.9 μg/m3, PM2.5는 72.4 μg/m3와 39.2~43.2 μg/m3였다. 이 중 PM2.5 농도를 그림 3의 상관식을 이용하여 임팩터 농도로 환산하면, 각각 54.5 μg/m3와 27.4~30.7 μg/m3가 되어 PM2.5/PM10 비는 0.64와 0.61~0.66이 된다. 이와 같은 PM2.5/PM10 비는, 미국 동부와 중서부 산업지대의 0.70보다 낮지만 여타 지역의 0.38~0.53보다 높고 (USEPA, 2004), 유럽 도시지역의 0.64~0.89, 전원 지역의 0.61~0.87에서는 낮은 쪽이다 (Van Dingenen et al., 2004).
그러나 우리나라에서 싸이클론을 이용하였음에도 Kim et al. (2006a)이 2002년 12월 세종대에서 측정한 결과에서는 PM2.5/PM10 비가 0.77이었고, Kim et al. (2006b)이 2002년 8월부터 2004년 7월까지 서울시립대에서 일곱 시즌 측정한 결과에서는 0.48로 낮았다. 이번 연구 (특히) 싸이클론 자료는, 비교적 장기간 중복 측정 결과를 이용하였지만 아직은 제한적으로 해석하는 것이 합당할 것으로 판단된다. PM2.5/PM10 비에서는 PM10을 조사하지 않았다는 점도 유의할 필요가 있다.
5. 결 론
경기도 용인에 위치한 한국외국어대학교 글로벌캠퍼스에서 2014년 8월부터 2017년 3월까지 싸이클론과 임팩터 (WINS), OPC를 이용하여 PM2.5를 측정하였다.
(1) 싸이클론으로 측정한 농도 (Y)와 임팩터로 측정한 농도 (X)의 최적 합치선은, 기울기 1.22, 절편 5.64 μg/m3로, 싸이클론으로 측정한 농도가 높았다. 임팩터의 유량이 정밀하게 제어된 데 비하여 싸이클론은 시료채취 후 유량이 다소 낮아졌으나 영향이 작았고, 유량 감소를 고려할 경우 둘의 농도 차이는 더욱 증가하였다.
(2) 그동안 싸이클론을 이용한 일부 수도권 측정에서 PM2.5/PM10 비가 높았는데, 이번 연구의 결과를 이용하여 PM2.5 농도를 환산하면 PM2.5/PM10 비가 0.61~0.66이 되었다. 이 값은 미국이나 유럽에서 2차 생성이 지배적인 지역에 비하여 낮은 편으로, 비산먼지의 영향을 추정할 수 있으나 (Choi et al., 2014) 일반화하기에는 추가 연구가 필요하였다.
(3) OPC (Y)와 임팩터 (X)의 최적 합치선은 절편이 6.79 μg/m3이었으나, 기울기가 0.95로 1에 근접하였다. PM2.5가 임팩터를 기준으로 정의된 만큼, 수농도를 질량농도로 환산할 때 임팩터에 상응하는 농도를 줄 수 있도록 환산계수를 설정한 것으로 생각되었다.
Acknowledgments
이 연구는 기상청 “기후변화 감시·예측 및 국가정책지원강화” 사업 (KMIPA 2015-6010)과 한국외국어대학교 교내학술연구비 지원으로 수행되었습니다.
References
-
Bae, M.-S., D.-J. Park, K.-H. Lee, S.-S. Cho, K.-Y. Lee, and K. Park, (2017), Determination of analytical approach for ambient PM2.5 free amino acids using LCMSMS, Journal of Korean Society for Atmospheric Environment, 33, p54-63, (in Korean with English abstract).
[https://doi.org/10.5572/kosae.2017.33.1.054]

-
Burkart, J., G. Steiner, G. Reischl, H. Moshammer, M. Neuberger, and R. Hitzenberger, (2010), Characterizing the performance of two optical particle counters (Grimm OPC1. 108 and OPC1. 109) under urban aerosol conditions, Journal of Aerosol Science, 41, p953-962.
[https://doi.org/10.1016/j.jaerosci.2010.07.007]

-
Choi, S.H., Y.S. Ghim, Y.S. Chang, and K. Jung, (2014), Behavior of particulate matter during high concentration episodes in Seoul, Environmental Science and Pollution Research, 21, p5972-5982.
[https://doi.org/10.1007/s11356-014-2555-y]

-
Chow, J.C., (1995), Measurement methods to determine compliance with ambient air quality standards for suspended particles, Journal of the Air & Waste Management Association, 45, p320-382.
[https://doi.org/10.1080/10473289.1995.10467369]

- Ghim, Y.S., and J.Y. Kim, (2004), Variations of NMHC and fine particles in Seoul in June 2001Variations of NMHC and fine particles in Seoul in June 2001, Journal of Korean Society for Atmospheric Environment, 20, p87-97, (in Korean with English abstract).
-
Grimm, H., and D.J. Eatough, (2009), Aerosol measurement: the use of optical light scattering for the determination of particulate size distribution, and particulate mass, including the semi-volatile fraction, Journal of the Air & Waste Management Association, 59, p101-107.
[https://doi.org/10.3155/1047-3289.59.1.101]

- Hering, S.V., (1995), Impactors, cyclones, and other inertial and gravitational collectors, In Air Sampling Instruments for Evaluation of Atmospheric Contaminants, 9th Ed., B.S. Cohen, and C.S.J. McCammon Eds., ACGIH, Cincinnati, OH, Chap, p14.
- Jeon, H., J. Park, H. Kim, M. Sung, J. Choi, Y. Hong, and J. Hong, (2015), The Characteristics of PM2.5 concentration and chemical composition of Seoul metropolitan and inflow background area in Korea Peninsula, Journal of the Korean Society of Urban Environment, 15, p261-271, (in Korean with English abstract).
- Kim, H., J. Jung, J. Lee, and S. Lee, (2015), Seasonal characteristics of organic carbon and elemental carbon in PM2.5 in Daejeon, Journal of Korean Society for Atmospheric Environment, 31, p28-40, (in Korean with English abstract).
-
Kim, J.H., and I.J. Hwang, (2016), The Characterization of PM, PM10, and PM2.5 from stationary sources, Journal of Korean Society for Atmospheric Environment, 32, p603-612, (in Korean with English abstract).
[https://doi.org/10.5572/kosae.2016.32.6.603]

- Kim, K.-H., V.K. Mishra, C.-H. Kang, K.C. Choi, Y.J. Kim, and D.S. Kim, (2006a), The ionic compositions of fine and coarse particle fractions in the two urban areas of Korea, Journal of Environmental Management, 78, p170-182.
- Kim, Y.J., K.W. Kim, S.D. Kim, B.K. Lee, and J.S. Han, (2006b), Fine particulate matter characteristics and its impact on visibility impairment at two urban sites in Korea: Seoul and Incheon, Atmospheric Environment, 40, p593-605.
-
Ko, H.-J., J.-M. Song, J.W. Cha, J. Kim, S.-B. Ryoo, and C.-H. Kang, (2016), Chemical composition characteristics of atmospheric aerosols in relation to haze, Asian dust and mixed haze-Asian dust episodes at Gosan site in 2013, Journal of Korean Society for Atmospheric Environment, 32, p289-304, (in Korean with English abstract).
[https://doi.org/10.5572/kosae.2016.32.3.289]

-
Lee, E.-S., M.-B. Park, T.-J. Lee, S.-D. Kim, D.-S. Park, and D.-S. Kim, (2016), Characterizing particle matter on the main section of the Seoul Subway Line-2 and developing fine particle pollution map, Journal of Korean Society for Atmospheric Environment, 32, p216-232, (in Korean with English abstract).
[https://doi.org/10.5572/kosae.2016.32.2.216]

-
Lee, S.H., Y.P. Kim, J.Y. Lee, and S.M. Lee, (2017), The Relationship between the estimated water content and water soluble organic carbon in PM10 at Seoul, Korea, Journal of Korean Society for Atmospheric Environment, 33, p64-74, (in Korean with English abstract).
[https://doi.org/10.5572/kosae.2017.33.1.064]

- Lee, Y.H., J.S. Park, J. Oh, J.S. Choi, H.J. Kim, J.Y. Ahn, Y.D. Hong, J.H. Hong, J.S. Han, and G. Lee, (2015), Field performance evaluation of candidate samplers for National Reference Method for PM2.5, Journal of Korean Society for Atmospheric Environment, 32, p157-163, (in Korean with English abstract).
-
McMurry, P.H., (2000), A review of atmospheric aerosol measurements, Atmospheric Environment, 34, p1959-1999.
[https://doi.org/10.1016/s1352-2310(99)00455-0]

- ME (Ministry of Environment), (2016), Revision of Standard Test Methods for Air Pollutants, Notification No. 2016-211.
- NARSTO, (2004), Particulate Matter Science for Policy Makers: A NARSTO Assessment, P. McMurry, M. Shepherd, and J. Vickery Eds., Cambridge University Press, Cambridge, England.
-
Peters, T.M., R.W. Vanderpool, and R.W. Wiener, (2001), Design and calibration of the EPA PM2.5 well impactor ninety-six (WINS), Aerosol Science & Technology, 34, p389-397.
[https://doi.org/10.1080/02786820120352]

- Solomon, P.A., P.K. Hopke, J. Froines, and R. Scheffe, (2008), Key scientific findings and policy- and health-relevant insights from the U.S. Environmental Protection Agency’s particulate matter supersites program and related studies: An integration and synthesis of results, Journal of the Air & Waste Management Association, 58, ps-3-s-92.
- Son, S.-C., M.-S. Bae, and S.-S. Park, (2015), Chemical characteristics and formation pathways of humic like substances (HULIS) in PM2.5 in an urban area, Journal of Korean Society for Atmospheric Environment, 31, p239-254, (in Korean with English abstract).
-
Song, S., J.E. Kim, E. Lim, J.-W. Cha, and J. Kim, (2015), Physical, chemical and optical properties of an Asian dust and haze episodes observed at Seoul in 2010, Journal of Korean Society for Atmospheric Environment, 31, p131-142, (in Korean with English abstract).
[https://doi.org/10.5572/kosae.2015.31.2.131]

- USEPA (US Environmental Protection Agency), (1997), National Ambient Air Quality Standards for Particulate Matter, 40 CFR Part 50, Federal Register, 62(138), p38652-38760.
- USEPA, (2004), Air Quality Criteria for Particulate Matter, EPA/600/P-99/002aF, Research Triangle Park, NC.
- USEPA, (2016), List of Designated Reference and Equivalent Methods, Research Triangle Park, NC.
- Van Dingenen, R., F. Raes, J.-P. Putaud, U. Baltensperger, A. Charron, M.-C. Facchini, S. Decesari, S. Fuzzi, R. Gehrig, H.-C. Hansson, R.M. Harrison, C. Hüglin, A.M. Jones, P. Laj, G. Lorbeer, W. Maenhaut, F. Palmgren, X. Querol, S. Rodriguez, J. Schneider, H. ten Brink, P. Tunved, K. Tørseth, B. Wehner, E. Weingartner, A. Wiedensohler, and P. Wåhlin, (2004), A European aerosol phenomenology - 2: physical characteristics of particulate matter at kerbside, urban, rural and background sites in Europe, Atmospheric Environment, 38, p2561-2577.
- WHO (World Health Organization), (2006), Health Risks of Particulate Matter from Long-range Transboundary Air Pollution, WHO Regional Office for Europe, Copenhagen, Denmark.
-
Won, S.R., Y.J. Choi, A. Kim, S.H. Choi, and Y.S. Ghim, (2010), Ion concentrations of particulate matter in Yongin in spring and fall, Journal of Korean Society for Atmospheric Environment, 26, p265-275.
[https://doi.org/10.5572/kosae.2010.26.3.265]

- Yu, J.-G., J.-H. Kim, K.-P. Kim, S.-Y. Jung, K.-I. Na, H.-J. Jo, K.-H. Sul, and K.-H. Kim, (2015), Comparison of PM2.5 pollution status at a major transit subway station in Seoul, Journal of Korean Society for Atmospheric Environment, 31, p201-208, (in Korean with English abstract).

