역궤적 이동경로별 용인지역의 컬럼에어로졸 특성
Copyright © 2017 Korean Society for Atmospheric Environment
Abstract
Columnar aerosol properties retrieved from solar radiation were investigated at the Yongin (YGN) SKYNET site over seven years from October 2008 to October 2015. Hourly averages were calculated when the data were available, and back trajectories were calculated to examine the effects of regional transport. Data recovery rate was low at 6.6%, primarily because solar radiation was measured only under daytime clear-sky conditions. Mean values of the fine-mode volume fraction (FMVF) as well as its seasonal variation were similar to those of PM2.5/PM10 although the coarse-mode fraction of column aerosols tended to be slightly larger. The values of single scattering albedo (SSA) and FMVF were lower in spring due to the effects of mineral dust, and higher in summer due to secondarily-formed inorganic ions. Back trajectories were grouped into five clusters according to the directions of transport paths. Aerosol loading was highest for Cluster 2 from the northwest, but SSA and FMVF were not particularly high or low because aerosols were composed of various materials with different properties. Aerosol loading was lowest for Cluster 5 from the Pacific Ocean passing through the south end of Japan, whose SSA and FMVF were highest as secondarily-formed inorganic ions were mixed.
Keywords:
Skyradiometer, Cluster analysis, Single scattering albedo, Fine-mode volume fraction1. 서 론
대기 중에 액체, 고체 형태로 부유하는 에어로졸은 빛을 흡수 및 산란시키며 시정을 감소시킬 뿐 아니라 태양복사, 구름 형성, 강우 등 기후변화에 영향을 미친다 (Rundell et al., 2008; Hansen et al., 1997; Charlson et al., 1992). 에어로졸의 특성에 대한 연구가 계속되고 있지만, 온실가스의 대기 중 체류시간이 수개월 내지 수년인데 비하여 에어로졸의 체류시간은 수일 정도로 짧기 때문에 시·공간 변화가 커서 복사강제력에 대한 불확실성이 여전하다 (Rundell et al., 2008; Hansen et al., 2000).
변화가 큰 에어로졸의 특성을 파악하기 위해 AERONET (Aerosol Robotic Network; Holben et al., 2001), SKYNET (Skyradiometer Network; Takamura et al., 2004)과 같은 지표광학측정망과 MODIS (Moderate Resolution Imaging Spectrometer; Remer et al., 2005)와 같은 위성원격탐사 이용이 활발하다. 지표광학측정망은 인공위성에 비해 시간 변화를 파악하기에 용이하지만 개별 측정소 자료로는 공간 변화를 알기 어렵다. 이에 따라 초기의 지표광학측정망 자료는 주로 특정 시점의 인공위성 자료 검증을 위해 사용되었다 (Holben et al., 2001). 하지만, 근래에는 세계 각지에 조밀하게 측정소가 분포되고 주요 지점에서 장기간 에어로졸을 측정함에 따라 시간 변화와 함께 공간 변화 조사에도 유용하다 (Eck et al., 2005; Kim et al., 2004; Dubovik et al., 2002).
지표광학측정망은 지표부터 대기 상부까지 컬럼을 측정하므로 지표 측정에 비하여 국지 변화의 영향이 제한적일 수 있다. 반면, HYSPLIT (Hybrid Single Particle Lagrangian Integrated Trajectory; Draxler et al., 2012) 모델을 이용한 역궤적 분석에 이상적 조건이어서, 군집분석 등 통계적 방법과 결합한 컬럼 에어로졸의 특성변화 연구도 활발하다 (Rozwadowska et al., 2010; Yan et al., 2008; Xia et al., 2007). 우리나라에서도 여러 연구팀이 컬럼 에어로졸의 광학특성을 토대로 에어로졸의 물리, 화학적 특성을 조사하였다 (Kim et al., 2008a, b, 2007; Lee et al., 2005). 그러나 지역 (regional) 규모 이동에 초점을 맞추어 오염물질의 이동에 따른 컬럼 에어로졸의 특성변화를 살핀 연구는 찾기 어렵다.
이번 연구에서는 수도권 동남쪽에 위치한 SKYNET YGN (Yongin) 측정소에서 2008년 10월부터 2015년 10월까지 7년간 스카이라디오미터를 이용하여 측정한 컬럼 에어로졸 특성 자료를 분석하였다. 일반적으로 사용하는 유클리드 거리 (Euclidean distance) 대신 각거리 (angle distance)를 토대로 방향에 따라 역궤적을 분류하였으며, 지표 오염특성과 비교하여 계절별, 역궤적 군집별 컬럼 에어로졸의 특성을 조사하였다.
2. 연구 방법
2. 1 측정지점과 기간
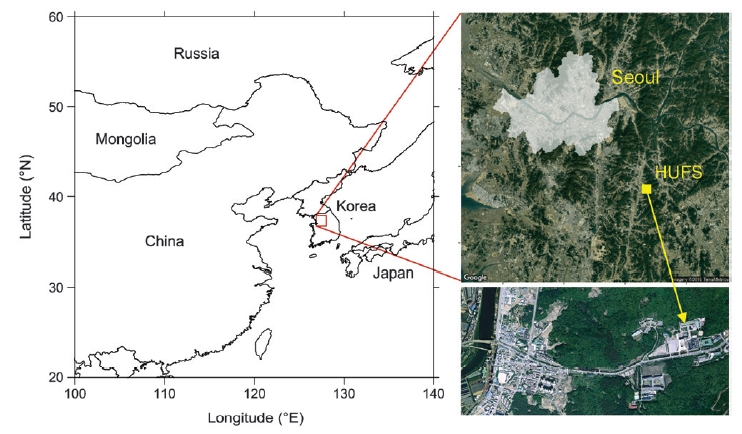
측정지점은 용인에 위치한 한국외국어대학교 글로벌캠퍼스 내 5층 건물인 자연과학대학 옥상 (127.27°E, 37.34°N, 해발고도 167 m)이다. 서울 시청으로부터 주풍인 편서풍의 풍하 방향인 남동쪽으로 약 35 km 거리에 있으며 (그림 1), 1.4 km 서쪽의 45번 국도를 제외하고는 두드러진 오염원이 없어 오염물질 이동이나 광화학 반응에 의한 2차 생성, 교외지역의 일반적 배출 특성 등을 조사하기에 이상적이다. 측정기간은 2008년 10월 20일부터 2015년 10월 8일까지이다.
2. 2 측정 및 자료이용
이번 연구에서 사용한 스카이라디오미터는 POM-02 (Prede)이다. 315, 340, 380, 400, 500, 675, 870, 940, 1020, 1627, 2200 nm 등 11개 파장에서 광학적 대기량 (airmass; 1/cosθ, θ는 천정각)에 따라 일정한 천정각에서 방위각을 변화시키며 산란일사를 측정하고, 산란일사를 측정하지 않을 때 30초 간격으로 일정한 방위각에서 천정각을 변화시키며 직달일사를 측정한다. 11개 파장 중 구름의 영향을 크게 받는 1627, 2200 nm 등 장파장과, 각각 오존과 수증기에 의하여 흡수되는 315 nm와 940 nm를 제외한 7개 파장을 에어로졸 특성조사에 이용할 수 있다.
AOD (aerosol optical depth)와 AE (Angstrom exponent)는 직달일사만으로부터도 산출되지만 SSA (single scattering albedo), 부피크기분포 등은 산란일사로부터 복원하여야 하며, 이번 연구에서는 skyrad.pack v5 (Hashimoto et al., 2012)를 이용하였다. 직달일사와 산란일사 AOD 모두의 시간 변화와 파장별 변화, 그리고 부피크기분포를 점검하여 구름의 영향을 받은 자료를 제거하였다 (Park et al., 2015). 또한 AERONET의 level 2 자료검증 기준에 따라 천정각이 50° 이상일 때만 복원된 자료를 이용하였다 (Holben et al., 2006). 동일한 검증기준에 의하면 SSA는 AOD 0.4 이상일 때 값을 이용하여야 하나, 에어로졸 농도가 높은 일부 지역을 제외하고는 AOD 0.4 이상의 발생 비율이 낮아 자료 이용이 제한되는 문제가 있다 (van Beelen et al., 2014). 이에 따라 SSA의 불확도가 크게 증가하지 않는 범위에서 자료 이용을 확대하기 위하여 AOD 기준을 0.2로 낮추어 적용하였다 (Choi and Ghim, 2016a; Arola et al., 2015).
이번 연구에서는 컬럼 에어로졸의 특성으로, 중간 파장대인 500 nm에서 AOD, SSA와 총 부피농도 (volume concentration, VC), 그리고 FMVF (fine mode volume fraction)를 조사하였다. AOD는 컬럼 내 에어로졸의 부하를 나타내는 지표이다. SSA는 산란과 흡수를 더한 전체 빛의 소멸 중 산란이 차지하는 비율인데, 2차 무기이온과 해염이 산란을 일으키는 반면 광물먼지 (mineral dust)와 BC (black carbon)는 빛을 흡수하여 에어로졸의 화학조성과 밀접하다. FMVF는 전체 VC 중 미세영역의 분율이다. 에어로졸 크기 지표로는 AE를 사용하는 것이 보통이나 가장 많이 관찰되는 값인 1~2 사이에서는 입자의 크기를 판단하기 어려워 정량적 지표라기보다 정성적 지표에 가깝다 (Schuster et al., 2006). 따라서 이번 연구에서는 전체 부피농도 중 미세영역의 분율을 정량적으로 알아볼 수 있도록 FMVF를 조사하였다. 미세영역과 조대영역은 양봉 분포에서 최저점을 기준으로 구분하였다 (그림 2). 스카이라디오미터의 최저점과 미세, 조대영역 최고점의 위치는 AERONET과 유사한 범위이며 (Prats et al., 2011; Dubovik et al., 2002), 미세, 조대영역의 부피농도는 AERONET보다 8~10% 크지만 FMVF는 거의 동일하다 (Kim et al., 2016).
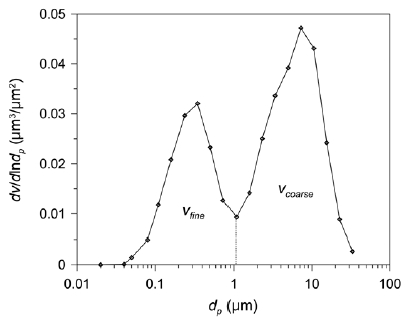
Mean volume size distribution over the entire measurement period. vfine and vcoarse denote the fine and coarse mode volume concentrations, respectively. The fine mode volume fraction (FMVF) is defined by vfine/vtotal, where vtotal is the sum of vfine and vcoarse. Fine and coarse modes are separated by the local minimum of the bimodal distribution, which is represented by dotted line.
2. 3 역궤적 분석
역궤적 분석에는 HYSPLIT 4 (Draxler et al., 2012) 모델을 이용하였다. 1°×1°, 3시간 간격의 GDAS (Global Data Assimilation System) 자료를 기상자료로 사용하였고, 연직 방향의 변화는 기상모델의 연직 속도로써 계산하였다. 지역 (regional) 규모 변화를 조사하기 위하여 측정지점 1500 m 상공에서 역궤적을 출발하여 120시간 동안 매시간 위치를 추적하였다. 역궤적 군집분석에는 Trajstat v1.2.2.6 (Wang et al., 2009)에서 제공하는 Ward 방법을 이용하였으며, 유클리드 거리 대신 각 (angle) 거리를 기준으로 군집을 분류하였다. 유클리드 거리를 이용할 경우 방향이 같아도 이동 속도의 차이가 크면 궤적의 차이도 커지나, 각거리는 궤적의 평균 각도를 토대로 궤적의 차이를 계산하므로 방향에 따라 궤적을 분류할 수 있기 때문이다 (Sirois and Bottenheim, 1995).
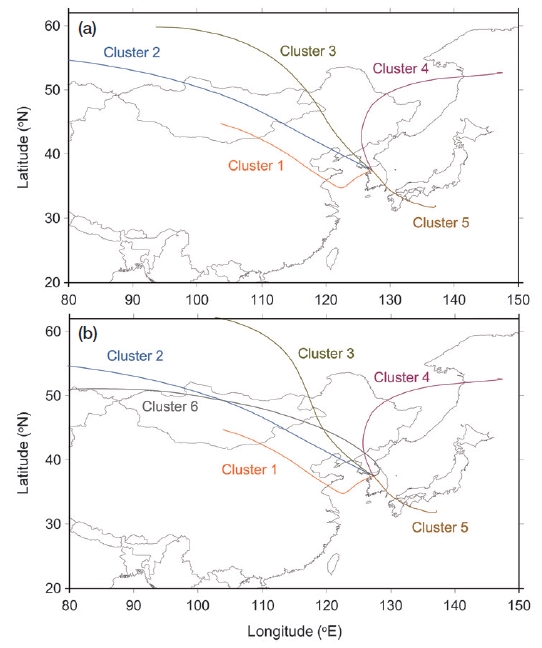
그림 3은 군집수에 따른 군집 간 에어로졸 특성 차이의 변화이다. 군집수가 증가할수록 궤적이 세밀하게 구분되므로 군집 간 특성 차이가 커지지만 5개와 6개는 거의 동일하다. 군집수가 6개로 증가함에 따라 군집수 5개 때 군집 3 궤적이 군집 3과 6 궤적으로 추가 구분되었으나 (그림 4) 추가된 군집의 에어로졸 특성은 기존 군집의 범위 내에 있어 (그림 3), 군집수를 5개로 결정하였다.
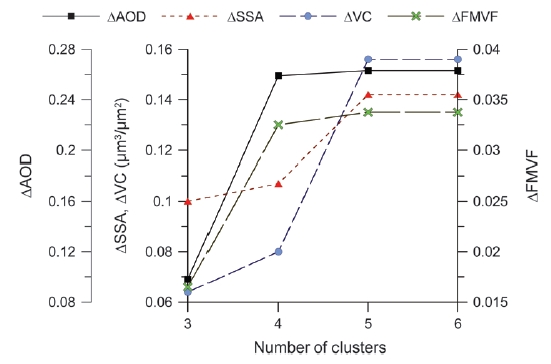
Differences in column aerosol properties between maximum and minimum values among clusters with increasing number of clusters.
3. 결과 및 토의
3. 1 자료 회수율과 자료 분포
표 1은 2008년 10월 20일부터 2015년 10월 8일까지 총 2,544일간 역궤적 군집별, 계절별 자료수와 분율이다. 측정기간 원시 (raw) 자료 총수는 64,137개이었으며, 구름의 영향을 받은 자료를 제거하면 49,391개 (77%), 천정각 50° 이상 자료만 이용하면 32,419개 (51%)였다. 컬럼 에어로졸 특성은 h-29분부터 h+30분까지 유효자료가 있을 때 1시간 평균을 산출하였으며, 역궤적은 h시에 출발하여 계산하였다. 표 1에서 시간평균 자료수가 4,037개이므로, 시간당 유효자료수는 32,419/4,037=8.0개이다.
측정기간 중 총 3차례 (2009-09-27부터 2010-02-18, 2011-06-15부터 2012-02-17, 2014-10-30부터 2015-01-05) 기기 결함으로 측정이 이루어지지 않았다. 그러나 장기간 측정에서 기기결함은 피할 수 없으므로 이를 포함하여 자료 회수율을 계산하면, 4,037/(2,544일×24시간/일)=6.6%이다. 대기환경의 보편적 측정에 비하여 자료 회수율이 낮은 가장 큰 이유는, 일사를 측정할 수 있는 낮에 구름이 없을 때만 자료를 얻을 수 있기 때문이다. 즉, 위성이든 지표든 일사 측정에 의한 컬럼 에어로졸 특성은 구름이 없는 맑은 날 낮의 특성이다. 이와 같은 자료 회수율은 Choi and Ghim (2016b)이 AERONET 측정소인 안면과 고산을 대상으로 계산한, 2004년 4월부터 2007년 11월 기간 안면의 7.4%보다 낮지만, 2003년 4월부터 2011년 6월 기간 고산의 4.4%보다 높다. 고산의 자료 회수율이 낮은 것은 기기결함에 의한 결측이 상대적으로 많았기 때문이다.
표 1의 계절별 자료수는 여름<가을<겨울<봄 순이다. 낮의 길이, 천정각 등 다양한 변수가 영향을 미칠 수 있지만 운량에 반비례하는 것이 보통이다 (Choi and Ghim, 2016a, b). 군집별로는 군집 2, 3이 많고 군집 5가 가장 적은데, 우리나라 주변을 북동쪽부터 5~6개 권역으로 나누었을 때 북서권역으로부터 이동이 많고 남-남동권역으로부터 이동이 적었던 이전 연구의 연간 분포와 유사하다 (Ghim et al., 2001; Kang et al., 1993). 겨울과 봄에 군집 2, 3의 분율이 높고, 여름에 군집 5의 분율이 높아지는 계절 변화도 유사하다. 즉, 구름이 없는 맑은 날 낮만을 대상으로 하였음에도 표 1의 연간 및 계별별 군집 분포는 전체 시간을 대상으로 한 연구결과와 다르지 않다. 이전 연구에서 청정한 지역으로 구분하였던 남남서 해양으로부터 이동 궤적이 이번 연구에서는 군집으로 분류되지 않았는데 (그림 4), 발생 빈도가 적을 뿐 아니라 자료수가 적은 여름에 주로 발생한 것이 원인일 수 있다.
3. 2 계절별 컬럼 에어로졸 특성
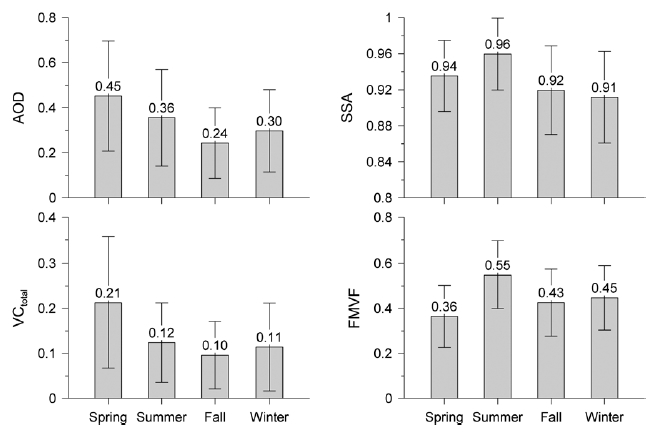
그림 5는 계절별 컬럼 에어로졸 특성이다. AOD, VC, FMVF는 표 1의 자료수와 동일하나 SSA는 AOD 0.2 이상 자료만 이용함에 따라 AOD가 낮은 가을에는 자료수가 456개로 표 1의 905개의 50%이며, AOD가 높은 봄에는 자료수가 1,323개로 표 1의 1,474개의 90%가 되는 등 전체적으로 AOD 등 자료수의 70% 수준이다.
봄에는 AOD와 함께 VC가 가장 높고 FMVF가 가장 낮다. 특히, FMVF가 0.36에 불과한데, 그림 2의 전체 기간 평균 입경분포에서도 미세영역보다 조대영역이 크다. FMVF는 지표측정의 PM2.5/PM10 비에 해당된다. 하지만 그림 5의 FMVF를 지표에서 측정한 PM2.5/PM10 비와 직접 비교하기는 어려운데, (1) 그림 2의 입경분포에서 조대영역의 상한이 10 μm을 넘고, (2) 조대영역의 하한이 2.5 μm보다 작으며, (3) 질량농도가 아닌 부피농도를 기준으로 하였고, (4) 지표가 아닌 컬럼의 값이기 때문이다. 그러나 조대영역에 주로 분포하는 광물먼지의 비중이 무기이온이나 탄소성분보다 경우에 따라서는 2배 이상 크므로 (Choi and Ghim, 2016a), (1), (2)로 인하여 커진 조대영역의 효과를 (3)으로 상쇄할 만하다. 지표측정 PM2.5/PM10 비는, 2004~2005년 서울 전농동에서 필터로 측정하였을 때 월평균 0.37~ 0.65 (KOSAE, 2006), 2002~2008년 서울 14개 측정소의 베타선 흡수법 측정에서는 0.42~0.57였다 (Ghim et al., 2015). 그림 5의 컬럼 에어로졸의 FMVF가 지표보다 낮은 경향을 보이나 차이가 크지 않으며, 봄에 낮고 여름에 높은 것도 지표와 동일하다 (Ghim et al., 2015).
봄에 AOD와 VC가 높은 것은 건조한 상태에서 풍속이 높아, 황사를 비롯한 비산먼지 등 광물먼지의 영향이 커졌기 때문일 가능성이 크다 (Choi et al., 2016; Choi et al., 2014). 광물먼지는 hematite, goethite 등 산화철이 빛을 흡수하기도 하지만 (Schuster et al., 2016) 조대입자의 영향으로 흡수 효과가 커져 SSA가 낮다 (Khatri et al., 2014). 여름에는 높은 기온과 강한 일사로 황산암모늄과 질산암모늄 등 2차 무기이온 농도가 높아 SSA와 FMVF가 높아질 수 있다 (Choi et al., 2016). 봄철에 비하여 VC가 42% 감소하였음에도 AOD는 21%만 감소하였는데, 미세영역의 입자들이 햇빛을 효과적으로 산란시키기 때문이다. 가을에는 AOD와 VC가 가장 낮다. 가을에는 농업잔재물 등 바이오매스 연소의 영향으로 OC (organic carbon) 배출이, 겨울에는 난방을 위한 화석연료 사용이 많아 BC 배출이 상대적으로 많다 (Jeong et al., 2011; Ryu et al., 2004). BC가 OC에 비하여 SSA가 낮은 반면 FMVF가 높아 (Choi et al., 2016), 가을에 비하여 겨울에 SSA가 감소하였고 FMVF는 증가한 것으로 해석할 수 있다.
3. 3 역궤적 군집별 컬럼 에어로졸 특성
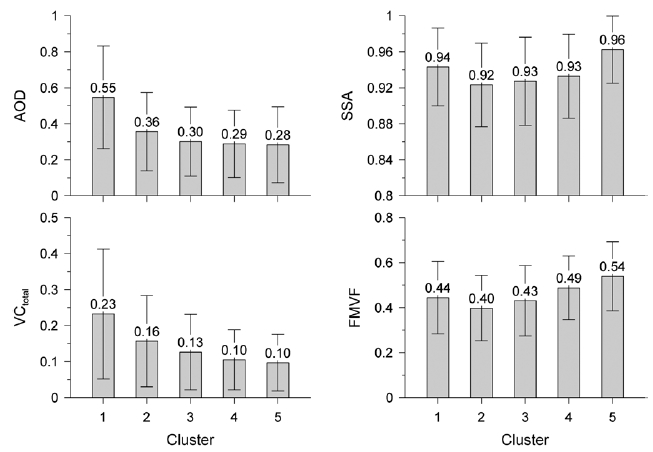
그림 6은 역궤적 군집별 컬럼 에어로졸 특성이다. 군집 1에서 AOD와 VC가 가장 높아 에어로졸 양이 가장 많다. 오염지역을 상대적으로 느리게 이동하며 많은 에어로졸을 함유하였지만 인위적 오염의 지표가 될 수 있는 SSA는 군집 2~4보다 높고 FMVF는 군집 4, 5보다 낮다. FMVF는 군집 2에서 가장 낮은데 SSA도 가장 낮아 광물먼지의 영향을 추정할 수 있다. 이동 경로상에 고비, 내몽골 등 주요 황사 발원지가 위치해 있고 (METRI, 2004) 조대입자를 충분히 이송할 만큼 이동 속도도 빠르기 때문이다. 뿐만 아니라, Lee et al. (2007)이 중국 전역의 CSHNET (Chinese Sun Hazemeter Network) 자료를 분석한 결과에 의하면 석탄 사용이 많은 북동부 공업지대와 함께 중국 서부 황사 발원지에서 SSA가 가장 낮았다. 반면, 군집 5에서는 AOD와 VC가 가장 낮아 에어로졸 양이 가장 작은 가운데, SSA와 FMVF가 가장 높다. 해양으로부터 유입되는 궤적이므로 광물먼지와 탄소물질 등 1차 배출물질의 영향이 작아 SSA가 높아질 수 있다. SSA가 높아진 원인으로는 해염을 생각할 수 있으나 조대입자인 해염의 영향이 지배적이라면 FMVF가 작아야 하고 AOD도 0.1 미만으로 더욱 낮아야 한다 (Smirnov et al., 2011, 2002). 일본을 거치며 2차 무기이온이 혼합되면서 FMVF와 함께 SSA가 높아진 것으로 보여진다.
군집 1의 궤적은 에어로졸 양이 많은 만큼 여러 물질이 혼합된 것으로 생각된다. 인위적 오염물질이 많다면 FMVF가 더욱 높아야 하나 (표 1에서 군집 1의 절반이 봄에 발생하는 것에서 볼 수 있는 것과 같이), 광물먼지가 혼합되며 FMVF가 낮아졌고, 연소 배출물의 영향으로 탄소물질이 많다면 SSA가 더욱 낮아야 하지만 (표 1에서 여름의 발생 비율도 높은 것과 같이) 2차 무기이온이 혼합되며 SSA가 상승하였을 수 있다. 군집 2가 광물먼지의 대표적 궤적이라면, 군집 3~5는 광물먼지의 영향이 차례로 감소하며 2차 무기이온의 영향이 커지는 모습이다. AOD와 VC가 차례로 감소하고 SSA와 FMVF는 증가하였다. 군집 1~3에서는 탄소물질의 비중도 상당할 것으로 추정되나, SSA는 광물먼지와, FMVF는 2차 무기이온과 경향이 유사하여 구분이 어렵다.
4. 요약 및 결론
한국외국어대학교 글로벌캠퍼스 내 SKYNET YGN 측정소에서 2008년 10월부터 2015년 10월까지 7년간 스카이라디오미터를 이용하여 측정한 컬럼 에어로졸의 특성을 조사하였다. 지표에 도달하는 일사를 측정하여 일사 감소로부터 에어로졸의 물리적, 광학적 특성을 복원하는 만큼 구름이 없는 맑은 날 낮에만 자료를 이용할 수 있어 자료회수율이 6.6%로 낮았다. 그러나 맑은 날 낮만을 대상으로 하였음에도 방향에 따라 분류한 역궤적 수는, 북서쪽으로부터 유입되는 군집 2, 3이 많고 남동쪽으로부터 유입되는 군집 5가 가장 적어 전체 시간을 대상으로 하였던 지금까지 결과와 유사하였다.
서울에서 측정한 PM2.5/PM10 비의 월평균이 0.37~ 0.65인데 비하여 FMVF의 계절 평균은 0.36~0.55로 다소 낮았지만 차이가 크지 않았고 봄에 낮고 여름에 높은 계절 변화도 동일하였다. 컬럼 에어로졸에서도 봄철에는 황사의 영향으로 SSA와 FMVF가 낮았고, 여름에는 2차 무기기온 생성의 영향으로 SSA와 FMVF가 높았다. 가을에는 바이오매스 연소에 의한 OC 배출이 많은데 비하여 겨울에는 난방을 위한 화석연료 사용으로 BC 배출이 많아 가을에 비하여 겨울에 SSA가 감소하고 FMVF가 증가하였다.
방향에 따른 역궤적 분류에서는 산동반도 남쪽을 지나 수도권 남서쪽으로 유입되는 군집 1 궤적에서 에어로졸 양이 가장 많았다. 그러나 특성이 상반된 다양한 물질이 혼합된 까닭에 SSA와 FMVF는 다른 군집에 비하여 특별히 높거나 낮지 않았다. 북서쪽으로부터 유입되는 군집 2는 광물먼지의 대표적 궤적으로 볼 만하였으며, 북북서, 북동쪽으로 방향이 변하며 광물먼지의 영향이 감소하였다. 해양으로부터 남동쪽으로 유입되는 군집 5 궤적은 에어로졸 양이 가장 작았지만 2차 무기이온의 영향으로 SSA와 FMVF가 가장 높았다.
일사를 측정할 수 있는 맑은 날 낮만을 대상으로 하였으나 역궤적 군집 분포에서는 이에 따른 편향은 발견되지 않았다. 컬럼은 지표부터 대기상부까지를 포괄함에도 컬럼 에어로졸의 특성은 지표오염과 밀접하였다. 에어로졸이 주로 지표 부근에 분포하기 때문으로 추정되나 에어로졸의 연직 분포는 오염물질에 따라 시기에 따라 다르므로 유의가 필요하다 (Yu et al., 2010; Schneider et al., 2006).
Acknowledgments
이 연구는 기상청 기후변화 감시·예측 및 국가정책지원강화 사업 (KMIPA 2015-6010), 2015년 대한민국 교육부와 한국연구재단 (NRF-2015S1A5B8036201), 그리고 한국외국어대학교 교내학술연구비 지원으로 수행되었습니다.
References
-
Arola, A., G.L. Schuster, M.R.A. Pitkänen, O. Dubovik, H. Kokkola, A.V. Lindfors, T. Mielonen, T. Raatikainen, S. Romakkaniemi, S.N. Tripathi, and H. Lihavainen, (2015), Direct radiative effect by brown carbon over the Indo-Gangetic Plain, Atmospheric Chemistry and Physics, 15(22), p12731-12740.
[https://doi.org/10.5194/acp-15-12731-2015]

-
Charlson, R.J., S.E. Schwartz, J.M. Hales, R.D. Cess, J.A. Coakley, J.E. Hansen, and D.J. Hofmann, (1992), Climate forcing by anthropogenic aerosols, Science, 255(5043), p423-430.
[https://doi.org/10.1126/science.255.5043.423]

-
Choi, S.-H., Y.S. Ghim, Y.-S. Chang, and K. Jung, (2014), Behavior of particulate matter during high concentration episodes in Seoul, Environmental Science and Pollution Research, 21(9), p5972-5982.
[https://doi.org/10.1007/s11356-014-2555-y]

-
Choi, Y., and Y.S. Ghim, (2016a), Estimation of columnar concentrations of absorbing and scattering fine-mode aerosol components using AERONET data, Journal of Geophysical Research: Atmospheres, 121.
[https://doi.org/10.1002/2016JD025080]

-
Choi, Y., and Y.S. Ghim, (2016b), Assessment of the clear-sky bias issue using continuous PM10 data from two AERONET sites, Journal of Environmental Sciences.
[https://doi.org/10.1016/j.jes.2016.02.020]

-
Choi, Y., Y.S. Ghim, and B.N. Holben, (2016), Identification of columnar aerosol types under high aerosol optical depth conditions for a single AERONET site in Korea, Journal of Geophysical Research: Atmospheres, 121, p1264-1277.
[https://doi.org/10.1002/2015jd024115]

- Draxler, R., B. Stunder, G. Rolph, A. Stein, and A. Taylor, (2012), HYSPLIT4 user’s guide, http://www.arl.noaa.gov/documents/reports/hysplit_user_guide.pdf (Last accessed September 2012).
-
Dubovik, O., B. Holben, T.F. Eck, A. Smirnov, Y.J. Kaufman, M.D. King, D. Tanré, and I. Slutsker, (2002), Variability of absorption and optical properties of key aerosol types observed in worldwide locations, Journal of the Atmospheric Sciences, 59(3), p590-608.
[https://doi.org/10.1175/1520-0469(2002)059<0590:voaaop>2.0.co;2]

-
Eck, T.F., B.N. Holben, O. Dubovik, A. Smirnov, P. Goloub, H.B. Chen, B. Chatenet, L. Gomes, X.-Y. Zhang, S.-C. Tsay, Q. Ji, D. Giles, and I. Slutsker, (2005), Columnar aerosol optical properties at AERONET sites in central eastern Asia and aerosol transport to the tropical mid-Pacific, Journal of Environmental Sciences: Atmospheres, 110(D6), pD06202.
[https://doi.org/10.1029/2004JD005274]

- Ghim, Y.S., Y.J. Kim, and J.Y. Kim, (2001), Influences of air trajectories on the variations of carbon monoxide in major cities in Korea for the year of 1999, Journal of Korean Society for Atmospheric Environment, 17, p451-461, (in Korean with English abstract).
- Ghim, Y.S., Y.-S. Chang, and K. Jung, (2015), Temporal and spatial variations in fine and coarse particles in Seoul, Korea, Aerosol and Air Quality Research, 15, p842-852.
-
Hansen, J., M. Sato, and R. Ruedy, (1997), Radiative forcing and climate response, Journal of Geophysical Research: Atmospheres, 102, p6831-6864.
[https://doi.org/10.1029/96jd03436]

-
Hansen, J., M. Sato, R. Ruedy, A. Lacis, and V. Oinas, (2000), Global warming in the twenty-first century: An alternative scenario, Proceedings of the National Academy of Sciences, 97(18), p9875-9880.
[https://doi.org/10.1073/pnas.170278997]

-
Hashimoto, M., T. Nakajima, O. Dubovik, M. Campanelli, H. Che, P. Khatri, T. Takamura, and G. Pandithurai, (2012), Development of a new data-processing method for SKYNET sky radiometer observations, Atmospheric Measurement Techniques, 5(11), p2723-2737.
[https://doi.org/10.5194/amt-5-2723-2012]

-
Holben, B.N., D. Tanré, A. Smirnov, T.F. Eck, I. Slutsker, N. Abuhassan, W.W. Newcomb, J.S. Schafer, B. Chatenet, F. Lavenu, Y.J. Kaufman, J.V. Castle, A. Setzer, B. Markham, D. Clark, R. Frouin, R. Halthore, A. Karneli, N.T. O’Neill, C. Pietras, R.T. Pinker, K. Voss, and G. Zibordi, (2001), An emerging ground-based aerosol climatology: Aerosol optical depth from AERONET, Journal of Geophysical Research: Atmospheres, 106(D11), p12067-12097.
[https://doi.org/10.1029/2001jd900014]

-
Holben, B.N., T.F. Eck, I. Slutsker, A. Smirnov, A. Sinyuk, J. Schafer, D. Giles, and O. Dubovik, (2006), Aeronet’s version 2.0 quality assurance criteria, Proceedings of SPIE (Society of Photo-Optical Instrumentation Engineers), 6408.
[https://doi.org/10.1117/12.706524]

- IPCC (Intergovernmental Panel on Climate Change), (2013), Summary for Policy Makers, In: Climate Change 2013: The Physical Science Basis, Contribution of Working Group I to the Fifth Assessment Report Cambridge University Press, Cambridge, United Kingdom and New York, NY, USA.
-
Jeong, U., J. Kim, H. Lee, J. Jung, Y.J. Kim, C.H. Song, and J.-H. Koo, (2011), Estimation of the contributions of long range transported aerosol in East Asia to carbonaceous aerosol and PM concentrations in Seoul, Korea using highly time resolved measurements: a PSCF model approach, Journal of Environmental Monitoring, 13(7), p1905-1918.
[https://doi.org/10.1039/c0em00659a]

- Kang, D.-K., S.-T. Kim, and J.-W. Kim, (1993), A study on the long-range transport of air pollutants in the North East Asia, Journal of Korea Air Pollution Research Association, 9, p329-339, (in Korean with English abstract).
-
Khatri, P., T. Takamura, A. Shimizu, and N. Sugimoto, (2014), Observation of low single scattering albedo of aerosols in the downwind of the East Asian desert and urban areas during the inflow of dust aerosols, Journal of Geophysical Research: Atmospheres, 119(2), p2013JD019961, 10.1002/2013JD019961.
[https://doi.org/10.1002/2013jd019961]

- Kim, B.-G., Y.-J. Kim, and S.-H. Eun, (2008a), An analysis of aerosol optical properties around Korea using AERONET, Journal of Korean Society for Atmospheric Environment, 24, p629-640, (in Korean with English abstract).
-
Kim, D.-H., B.-J. Sohn, T. Nakajima, T. Takamura, T. Takemura, B.-C. Choi, and S.-C. Yoon, (2004), Aerosol optical properties over east Asia determined from ground-based sky radiation measurements, Journal of Environmental Sciences: Atmospheres, 109(D2), pD02209.
[https://doi.org/10.1029/2003JD003387]

-
Kim, S.-W., S.-C. Yoon, J. Kim, and S.-Y. Kim, (2007), Seasonal and monthly variations of columnar aerosol optical properties over east Asia determined from multi-year MODIS, LIDAR, and AERONET Sun/sky radiometer measurements, Atmospheric Environment, 41(8), p1634-1651.
[https://doi.org/10.1016/j.atmosenv.2006.10.044]

- Kim, P., Y. Choi, and Y.S. Ghim, (2016), Comparison of aerosol volume size distributions between surface and ground-based remote sensing measurements downwind of Seoul, Korea during MAPS-Seoul, AGU 2016 Fall Meeting, December 12-16, San Francisco, CA.
- Kim, S.-W., S.-C. Yoon, and J. Kim, (2008b), Columnar Asian dust particle properties observed by sun/sky radiometers from 2000 to 2006 in Korea, Atmospheric Environment, 42, p492-504.
- KOSAE (Korean Society for Atmospheric Environment), (2006), Studies on Air Quality Management Plan for the Metropolitan Area (IV) - Investigation of Sources of Particulate Matter and Formulation of Control Strategies, National Institute of Environmental Research, Incheon, Korea (in Korean).
-
Lee, K.H., J.E. Kim, Y.J. Kim, J. Kim, and W. von Hoyningen-Huene, (2005), Impact of the smoke aerosol from Russian forest fires on the atmospheric environment over Korea during May 2003, Atmospheric Environment, 39, p85-99.
[https://doi.org/10.1016/j.atmosenv.2004.09.032]

-
Lee, K.H., Z. Li, M.S. Wong, J. Xin, Y. Wang, W.-M. Hao, and F. Zhao, (2007), Aerosol single scattering albedo estimated across China from a combination of ground and satellite measurements, Journal of Geophysical Research: Atmospheres, 112, pD22S15.
[https://doi.org/10.1029/2007JD009077]

- METRI (Meteorological Research Institute), (2004), Asian dust (fact sheet).
- Park, J.S., Y. Choi, and Y.S. Ghim, (2015), Comparison of aerosol volume size distributions between column and surface measurements downwind of Seoul, Korea, American Geophysical Union 2015 Fall Meeting, December 14-18, San Francisco, CA.
-
Prats, N., V.E. Cachorro, A. Berjón, C. Toledano, and A.M. De Frutos, (2011), Column-integrated aerosol microphysical properties from AERONET Sun photometer over southwestern Spain, Atmospheric Chemistry and Physics, 11(24), p12535-12547.
[https://doi.org/10.5194/acp-11-12535-2011]

-
Remer, L.A., Y.J. Kaufman, D. Tanré, S. Mattoo, D.A. Chu, J.V. Martins, R.-R. Li, C. Ichoku, R.C. Levy, R.G. Kleidman, T.F. Eck, E. Vermote, and B.N. Holben, (2005), The MODIS Aerosol Algorithm, Products, and Validation, Journal of the Atmospheric Sciences, 62(4), p947-973.
[https://doi.org/10.1175/jas3385.1]

- Rozwadowska, A., T. Zieliński, T. Petelski, and P. Sobolewski, (2010), Cluster analysis of the impact of air backtrajectories on aerosol optical properties at Hornsund, Spitsbergen, Atmospheric Chemistry and Physics, 10, p877-893.
-
Ryu, S.Y., J.E. Kim, H. Zhuanshi, Y.J. Kim, and G.U. Kang, (2004), Chemical composition of post-harvest biomass burning aerosols in Gwangju, Korea, Journal of the Air & Waste Management Association, 1995, 54(9), p1124-1137.
[https://doi.org/10.1080/10473289.2004.10471018]

-
Schneider, J., S.S. Hings, B.N. Hock, S. Weimer, S. Borrmann, M. Fiebig, A. Petzold, R. Busen, and B. Kärcher, (2006), Aircraft-based operation of an aerosol mass spectrometer: Measurements of tropospheric aerosol composition, Journal of aerosol science, 37(7), p839-857.
[https://doi.org/10.1016/j.jaerosci.2005.07.002]

-
Schuster, G.L., O. Dubovik, and B.N. Holben, (2006), Angstrom exponent and bimodal aerosol size distributions, Journal of Geophysical Research: Atmospheres, 111(D7), pD07207.
[https://doi.org/10.1029/2005JD006328]

-
Schuster, G.L., O. Dubovik, and A. Arola, (2016), Remote sensing of soot carbon - Part 1: Distinguishing different absorbing aerosol species, Atmospheric Chemical and Physics, 16(3), p1565-1585.
[https://doi.org/10.5194/acp-16-1565-2016]

-
Sirois, A., and J.W. Bottenheim, (1995), Use of backward trajectories to interpret the 5-year record of PAN and O3 ambient air concentrations at Kejimkujik National Park, Nova Scotia, Journal of Geophysical Research: Atmospheres, 100(D2), p2867-2881.
[https://doi.org/10.1029/94jd02951]

-
Smirnov, A., B.N. Holben, Y.J. Kaufman, O. Dubovik, T.F. Eck, I. Slutsker, C. Pietras, and R.N. Halthore, (2002), Optical properties of atmospheric aerosol in maritime environments, Journal of the Atmospheric Science, 59(3), p501-523.
[https://doi.org/10.1175/1520-0469(2002)059<0501:opoaai>2.0.co;2]

-
Smirnov, A., B.N. Holben, D.M. Giles, I. Slutsker, N.T. O’Neill, T.F. Eck, A. Macke, P. Croot, Y. Courcoux, S.M. Sakerin, T.J. Smyth, T. Zielinski, G. Zibordi, J.I. Goes, M.J. Harvey, P.K. Quinn, N.B. Nelson, V.F. Radionov, C.M. Duarte, R. Losno, J. Sciare, K.J. Voss, S. Kinne, N.R. Nalli, E. Joseph, K. Krishna Moorthy, D.S. Covert, S.K. Gulev, G. Milinevsky, P. Larouche, S. Belanger, E. Horne, M. Chin, L.A. Remer, R.A. Kahn, J.S. Reid, M. Schulz, C.L. Heald, J. Zhang, K. Lapina, R.G. Kleidman, J. Griesfeller, B.J. Gaitley, Q. Tan, and T.L. Diehl, (2011), Maritime aerosol network as a component of AERONET - first results and comparison with global aerosol models and satellite retrievals, Atmospheric Measurement Techniques, 4(3), p583-597.
[https://doi.org/10.5194/amt-4-583-2011]

- Takamura, T., T. Nakajima, and Nakajima, and SKYNET community group, (2004), Overview of SKYNET and its activities, Optica Pura y Aplicada, 37(3), p3303-3308.
-
van Beelen, A., G. Roelofs, O. Hasekamp, J. Henzing, and T. Röckmann, (2014), Estimation of aerosol water and chemical composition from AERONET Sun-sky radiometer measurements at Cabauw, the Netherlands, Atmospheric Chemistry and Physics, 14(12), p5969-5987.
[https://doi.org/10.5194/acp-14-5969-2014]

-
Wang, Y.Q., X.Y. Zhang, and R.R. Draxler, (2009), TrajStat: GIS-based software that uses various trajectory statistical analysis methods to identify potential sources from long-term air pollution measurement data, Environmental Modelling & Software, 24(8), p938-939.
[https://doi.org/10.1016/j.envsoft.2009.01.004]

-
Xia, X., H. Chen, and W. Zhang, (2007), Analysis of the dependence of column-integrated aerosol properties on long-range transport of air masses in Beijing, Atmospheric Environment, 41(36), p7739-7750.
[https://doi.org/10.1016/j.atmosenv.2007.06.042]

-
Yan, P., J. Tang, J. Huang, J.T. Mao, X.J. Zhou, Q. Liu, Z.F. Wang, and H.G. Zhou, (2008), The measurement of aerosol optical properties at a rural site in Northern China, Atmospheric Chemistry and Physics, 8(8), p2229-2242.
[https://doi.org/10.5194/acp-8-2229-2008]

-
Yu, H., M. Chin, D.M. Winker, A.H. Omar, Z. Liu, C. Kittaka, and T. Diehl, (2010), Global view of aerosol vertical distributions from CALIPSO lidar measurements and GOCART simulations: Regional and seasonal variations, Journal of Geophysical Research: Atmospheres, 115, pD00H30.
[https://doi.org/10.1029/2009JD013364]


