패시브 샘플러를 이용한 전라북도 대기 중 암모니아 공간 분포 분석
 ; Sang-Min Oh1)
 ; Min-Suk Bae2)
 ; Yong-Jae Lim3) ; YuWoon Chang3) ; Mijung Song1), 4), 5), *
Abstract
Atmospheric ammonia (NH3) is a key important pollutant contributing to air quality and ecosystem. However, distributions and characteristics of atmospheric NH3 are still poorly understood. In this study, using passive samplers, we measured atmospheric NH3 concentrations from ten different monitoring sites at an urban area (three sites in Jeonju), a livestock area (three sites in Jeongeup), an agricultural area (three sites in Gimje), and a remote area (one site in Saemangeum) in Jeollabuk-do from June to December 2020. During the entire periods, a livestock area #3 showed the highest NH3 concentration of ~161.1 ppb while a remote area #1 presented the lowest NH3 concentration of ~4.9 ppb. During the summertime, there was a significant increase in atmospheric NH3 levels at most sites. However, high NH3 level was observed in winter at the point emission source of a large-scale pig farm due to the production of livestock manure and chemical fertilizer. During the whole periods, the average atmospheric NH3 concentrations ranged in the livestock area (72.7±73.6 ppb)>agricultural area (34.9±26.4 ppb) > urban area (13.0±6.2 ppb)>remote area in Saemangeum (4.9±1.8 ppb). These results would be useful to establish an effective policy for ammonia reduction.
Keywords:
Ammonia, Emission source, Passive sampler, Jeollabuk-do1. 서 론
암모니아 (NH3)는 염기성의 가스상 물질로 대기 중에서 질산, 황산 등의 산성물질과 반응하여 질산염, 황산염과 같은 미세먼지를 생성하는 주요한 전구물질로 알려져 있다 (Stelson and Seinfeld, 1982; Doyle et al., 1979). 이러한 NH3는 전 세계적으로 약 80% 이상이 가축사육 및 농업으로부터 배출되며, 특히 전 세계 NH3 중 절반 이상이 아시아에서 배출되는 것으로 보고되고 있다 (Kang et al., 2016; Streets et al., 2003; Bouwman et al., 1997; Zhao and Wang, 1994).
2017년 국가대기오염물질 배출량 통계 (CAPSS)에 따르면, 2005부터 2017년까지 국내 NH3 배출량은 꾸준한 증가 추세를 보이고 있다 (CAPSS, 2017). 통계 자료에서 2017년 전국 NH3 배출량은 308,298 톤이며, 그 중 농축산업이 약 80%를 차지하고, 생산공정 약 14%, 기타 면오염원 약 4%로 나타났다. 농축산업 배출 부문에서는 축사 기원의 NH3가 약 223,600 톤으로 약 93%를 차지하고 있다.
전라북도는 연간 NH3 배출량이 32,742 톤으로 국내 17개 시도 중 5위로 나타나고 있다 (CAPSS, 2017). 전라북도 내 NH3 배출량은 정읍이 5,692 톤으로 가장 많고, 익산 4,100 톤, 김제 4,021 톤 순이며, 도심지역인 전주의 경우 1,030 톤으로 나타났다. 전라북도 NH3의 주요 배출원은 농축산업이 31,515 톤으로 전체의 96%를 차지하고 있으며, 농축산업 부문에서는 분뇨관리가 29,095 톤 (89%), 비료사용 농경지가 2,421 톤 (7%)로 전북지역 대부분의 NH3가 농축산업에서 배출되는 것으로 보고되었다.
대기 중 NH3는 다양한 환경에서 측정되었다. 국내에서는 2019년 5월~2020년 1월까지 전주에서 NH3의 농도를 측정하였고, 실시간 평균 농도는 약 11 ppb였다 (Park et al., 2020). 2009~2018년 국내 건성강하물 측정망 자료를 분석한 결과, 측정망 중에서 축사가 밀집한 이천시 설성면 측정망의 NH3 농도가 약 50 ppb로 높은 수준을 나타내었다 (Sung et al., 2020). 국외에서는 2015년 여름철 일본 오사카에서 측정된 대기 중 NH3 농도는 약 4.2 ppb였다 (Huy et al., 2017). 반면 2013년 7월 여름철 중국 화베이 평야, 농촌지역에서 측정된 대기 중 NH3 농도는 73.9 ppb로 매우 높은 수준을 나타냈다 (Meng et al., 2018). 대기 중 NH3는 측정 지역의 환경, 계절에 따라 다양한 농도로 관측되었다. 이러한 NH3는 악취를 발생시킬 뿐만 아니라 미세먼지를 생성하는 주요한 전구물질로 알려져 있으며, Xu et al. (2019)는 중국에서 NH3를 저감시키는 것이 고농도 미세먼지를 줄이는데 효과적이라고 제시하였다. 그러나 현재까지 국내 주요 NH3 배출 오염지역에 대한 NH3 농도 자료는 매우 부족한 실정이다.
본 연구에서는 2020년 6~12월 패시브 샘플러 (passive sampler)를 이용하여 전라북도 도심지역, 축산지역, 농업지역, 서해안 인근 지역 총 10군데에서 NH3 농도를 분석하였다. 측정자료를 이용하여 전북지역 여름, 가을, 겨울철 NH3의 시·공간적 농도 분포를 살펴보고자 하였다.
2. 실험 방법
2. 1 측정장소
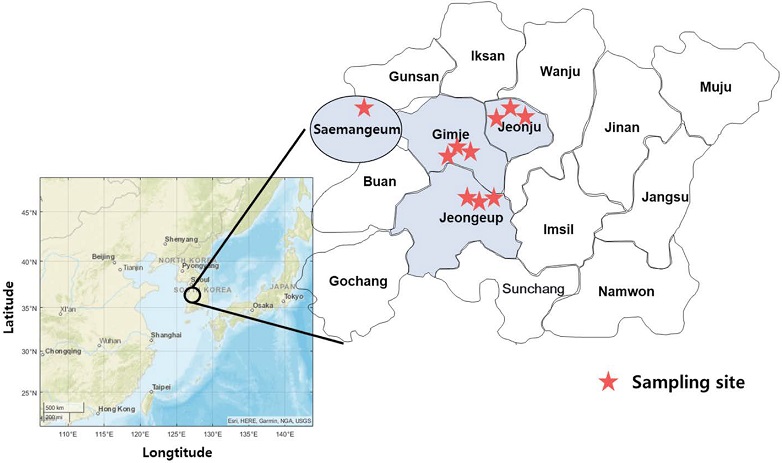
2020년 6~12월 NH3 배출 특성을 고려하여 도심 (전주 3곳), 축산지역 (정읍 3곳), 농경지 (김제 3곳), 배출원이 비교적 적은 새만금 방조제 1곳, 총 10개 지점에서 대기 중 NH3를 측정하였다 (그림 1, 표 1). 정읍은 대단위 축산단지 및 농경지가 형성되어 있는 대표적인 축산 지역이며, 전라북도 17개 시군 중에 NH3 배출량이 가장 높은 곳이다 (CAPSS, 2017). 본 연구에서는 정읍 옹동면 오성리의 모돈, 자돈, 비육돈 등 약 6000두 정도를 사육하고 있는 양돈농가의 부지경계 한 지점과 부지경계에서 약 1~2 km 떨어진 옹동면의 두 지점에서 NH3를 채취하였다. 김제는 경지면적이 약 26000 ha로 국내 대표적인 농업지역이다 (KOSTAT, 2020). 김제시 봉남면 한 곳과 서정동 두 곳의 농경지 총 세 지점에서 NH3를 채취하였다. 김제의 세 지점은 서로 약 1~2 km 떨어진 위치에 있다. 전주는 전라북도 중심에 위치하고, 김제, 정읍, 완주, 익산과 맞닿아 있으며, 인구가 가장 많은 지역으로 대단위 주거단지가 형성되어 있다. 전주에서는 전북대학교 자연대 옥상, 팔복동 제 1산업단지, 대규모 신도시 아파트 단지 (혁신도시) 각 한 곳, 총 세 지점에서 측정하였다. 그리고 NH3의 배출원이 적은 지역으로 서해 인근 군산시 비응도동 새만금 방조제를 선정하여 한 곳에서 측정을 진행하였다.
2. 2 측정방법
총 10개 측정지점에서 대기 중 NH3는 Radiello사의 패시브 샘플러 (RAD168, Radiello, USA)를 이용하여 채취하였다. 패시브 샘플러를 이용한 NH3 채취와 분석은 많은 선행연구에서 보고되었다 (Chang et al., 2019; Zhou et al., 2019; Li et al., 2017; Xu et al., 2016; Day et al., 2012; Puchalski et al., 2011). 패시브 샘플러는 확산표면 (diffusive surface)과 흡착표면 (absorbing surface)으로 구성된다. 미세 다공성 폴리에틸렌 (microporous polyethylene)으로 제작된 확산표면에서 NH3를 확산시키고, 인산 (H3PO4)으로 처리된 흡착표면에 NH3가 흡착되는 원리이다. 이러한 패시브 샘플러는 사용이 용이하고, 별도의 전원 공급 없이 이용할 수 있는 장점이 있다 (RAD168, Radiello, manual). 반면, NH3 흡착량이 너무 적을 경우, 분석 시 불확도가 높을 수 있고, 너무 오랫동안 대기 중에 노출될 경우, 포화상태에 도달하여 정확한 농도 산출이 어려울 수 있다 (Pienaar et al., 2015).
본 연구에서 패시브 샘플러 설치는 지표면으로부터 약 2~10 m 높이에 Radiello사에서 제공한 쉘터를 설치하였고, 쉘터 내부에 패시브 샘플러를 연결하여 NH3를 채취하였다. 본 연구에서는 패시브 샘플러에 분석이 가능한 NH3 양을 고려하여 이틀간 (48시간) 채취하였고, 모든 측정 지점에서 같은 날 오전 10시에 시작하였다. 예외적으로, 새만금 측정지점은 NH3 오염원이 타지역에 비해 적은 것을 고려하여 매주 토요일 오전 10시부터 일주일 동안 채취하였다. 본 연구에서 사용된 패시브 샘플러의 권장 NH3 채취량은 2,000~20,000,000 μg·min/m3 범위에서 정확한 측정이 가능하다 (RAD168, Radiello, manual). 전체 측정 기간 동안 NH3 농도가 가장 높았던 양돈농가 부지경계 지점의 12월 9일 시료와 가장 낮았던 새만금 지역의 12월 12일 시료의 NH3 채취량은 각각 597,384, 10,051 μg·min/m3로 분석되었다. 따라서 본 연구 측정 결과 중 전체 데이터가 샘플러의 NH3 농도 허용범위 안으로 검출되었다.
채취된 시료는 6 mL의 3차 증류수 (18 MΩcm, Merck, Direct-Q 3 UV, USA)에서 진탕기 (Shaking Water Bath, KMC-1205SW1, VISION, Korea)에서 45분간 추출한 뒤, 주사기 필터 (0.45 μm, PTFE syringe filter, Pall, USA)에 걸려진 추출액을 이온 크로마토그래피 (AQUION, Dionex, USA)를 이용하여 NH4+ 이온으로 분석하였다. 분석된 NH4+ 농도는 식 1을 이용하여 NH3 농도 (μg/m3)로 계산하였다 (Li et al., 2017; RAD168, Radiello, manual). 산출된 NH3 농도 (μg/m3)는 식 2를 이용하여 최종 ppb 단위로 변환하였다. 총 7개의 필드블랭크를 이용하여 98% 신뢰구간에서 산정된 검출한계 (Measurement detection limit)는 약 1.2 ppb (0.85 μg/m3)로 나타났다.
| (1) |
| (2) |
- CNH3: NH3 농도 (ppb)
- mNH4: 이온 크로마토그래피에서 분석된 NH4+ 질량 (μg)
- t: 채취 시간 (min)
- 14.2 cm: (유효 단면적/확산거리 (cm)) (Puchalski et al., 2011; Perrino and Catrambone, 2004)
- D0,1: 대기 중 NH3 확산도 (273 K, 1 atm), 11.87 cm2 min-1 (Roadman et al., 2003; Massman, 1998)
- mNH3: NH3의 분자량 (g/mol)
- P: 대기압 (atm)
- T: 대기 온도 (K)
- P0: 1 atm
- T0: 273 K
3. 결 과
3. 1 전라북도 월별, 계절별 암모니아 농도 분포
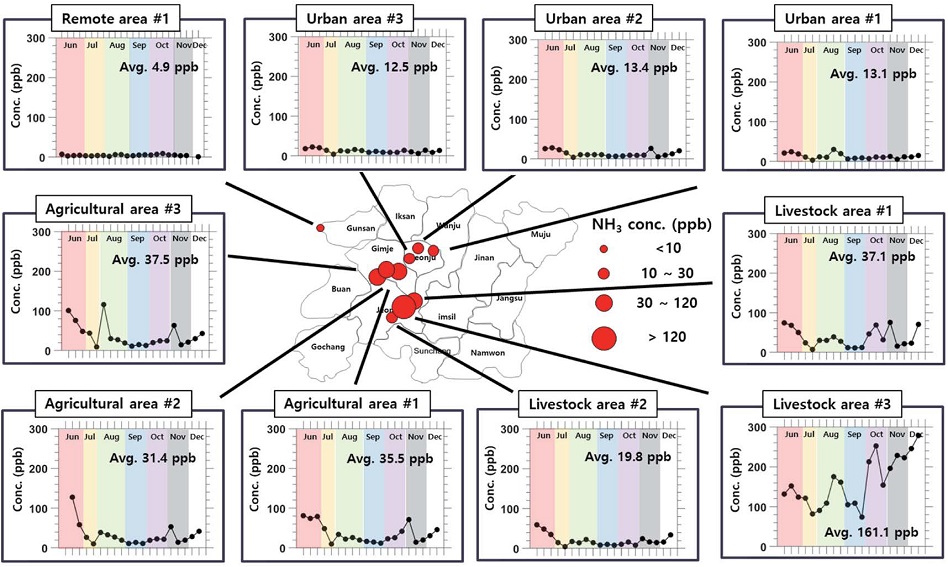
2020년 6~12월 전라북도 10개 측정 지점별 NH3 농도분포를 그림 2에 도식하였다. 전체 측정 기간 동안 대기 중 NH3의 농도는 매우 광범위하게 나타났다. 전체 측정 기간 동안 NH3는 축산마을 #3에서 약 278.0 ppb로 가장 높게 나타났고, 새만금 방조제에서 약 1.3 ppb로 가장 낮은 농도로 측정되었다. 전체 평균 NH3 농도는 축산마을 #3 (161.1 ppb)>농경지 #1 (37.5 ppb)>축산마을 #1 (37.1 ppb)>농경지 #3 (35.5 ppb)>농경지 #2 (31.4 ppb)>축산마을 #2 (19.9 ppb)>도심지역 #2 (13.4 ppb)>도심지역 #1 (13.1 ppb)>도심지역 #3 (12.5 ppb)>새만금 방조제 (4.9 ppb) 순으로 나타났다.

Atmospheric NH3 concentrations measured with passive samplers at 10 different locations from June to December 2020 in Jeollabuk-do.
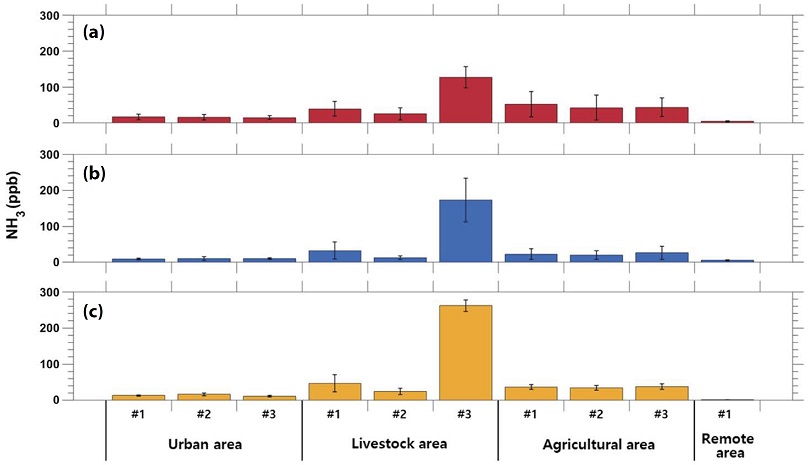
그림 3과 표 1은 2020년 계절별 전라북도 10개 측정지점의 NH3 농도분포를 보여준다. 본 연구에서 여름은 6~8월, 가을은 9~11월, 겨울은 12월로 정의하였다. 계절별 분석 결과, 여름철 NH3의 평균농도는 축산마을 #3에서 약 127.3 ppb로 가장 높고, 새만금 방조제에서 4.7 ppb로 가장 낮았다. 가을철과 겨울철도 같은 양상으로 축산마을 #3에서 각각 172.6, 261.8 ppb로 가장 높았고, 새만금 방조제에서 각각 5.5, 1.3 ppb으로 가장 낮았다.

Seasonal variations of atmospheric NH3 at ten different sites in Jeollabuk-do: (a) summer (b) autumn, and (c) winter.
일반적으로 NH3는 온도 의존적인 (Temperature-dependent) 물질로 여름철에 높은 농도를 보이는 것으로 보고되고 있다 (Chang et al., 2019; Meng et al., 2018; Pan et al., 2018; Xu et al., 2016; Wang et al., 2015). 본 연구에서도 대부분의 측정지점에서 여름철 NH3의 고농도 현상이 관찰되었다. 그러나 예외적으로 축산마을 #1, 축산마을 #3, 도심지역 #2에서는 겨울철에 높은 농도를 보이는 것이 특징적이었다. 대형 양돈농가에서는, 퇴비 생산 시설을 포함하고 있는 경우가 많다. 특히, 농업활동이 빈번한 봄철 (모종, 파종 등)에 필요한 퇴비 생산을 위해 겨울철 퇴비 생산이 활발하다 (Jeong et al., 2014). 따라서 양돈농가 인근에서 관측된 겨울철 대기 중 NH3의 고농도 현상은 겨울철 활발한 퇴비 생산에 의한 것으로 보여진다. 도심지역 #2 (산업밀집지역)는 주변에 생산공장이 밀집되어 있고 도로변에 인접하고 있다. 도심지역 #2에서도 겨울철 NH3의 고농도 현상이 관측되었으며, 이는 산업활동과 자동차에서 배출된 NH3가 겨울철 낮아진 대기혼합층의 영향에 의해 (Bytnerowicz et al., 2010; Sharma et al., 2010) 대기 중에서 고농도의 NH3가 측정된 것으로 판단된다.
3. 2 배출 특성별 대기 중 암모니아 농도 분포
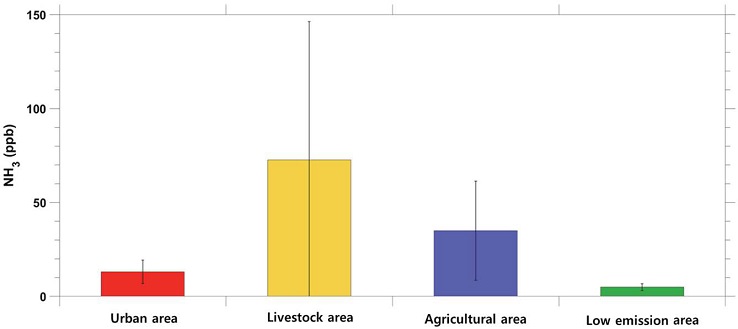
전체 측정 기간 동안 NH3 주요 배출 특성에 따른 대기 중 NH3 농도 분포를 분석하였다. 그림 4는 도심지역 (도심지역 #1, #2, #3), 축사밀집지역 (축산마을 #1, #2, #3), 농경지 밀집지역 (농경지 #1, #2, #3), 새만금 방조제의 대기 중 NH3의 평균 농도를 보여준다.

A comparison of atmospheric ammonia concentration from different environments from June to December 2020 in Jeollabuk-do.
전라북도 도심지역의 경우, 대기 중 NH3 평균 농도는 약 13.0 ppb였고, 3 측정지점의 평균농도는 비슷한 수준을 보였다 (도심지역 #2: 13.4 ppb, 도심지역 #1: 13.1 ppb, 도심지역 #3: 12.5 ppb). 세 개 지점 평균 여름철 NH3 농도는 15.9 ppb로, 이는 2019년 측정된 전주 삼천동 여름철 NH3 농도인 13.3 ppb보다 약간 높은 수준이었다 (Park et al., 2020). Song et al. (2020)는 2019년 12월 2일부터 15일까지 목포에서 측정된 NH3의 농도를 약 9.5 ppb로 보고하였다 (표 2). 목포에서 측정된 NH3는 NH4+의 형태로 중국으로부터 장거리 이동된 것으로 분석하였으나, 겨울철 2주간의 측정 결과이므로 추가적인 연구의 필요성을 제시하였다.
축사 밀집지역의 NH3 평균 농도는 약 72.7 ppb였고, 도심 지역보다 5배 이상, 새만금 방조제보다 14배 이상 높은 수준이다. 정읍 축산마을의 NH3는 측정지점에 따라 농도 범위가 매우 상이하였다. 대형 양돈농가 부지경계인 축산마을 #3에서는 점오염원의 영향으로 평균 약 161.1 ppb로 매우 높은 수준의 NH3가 관찰되었다. 부지경계로부터 약 1~2 km 떨어진 축산마을 #1에서의 NH3는 약 37.1 ppb, 축산마을 #2 약 19.9 ppb로 나타났다. Theobald et al. (2015)는 농가로부터 500 m만 멀어지더라도 대기 중 희석효과에 의해 NH3의 농도가 현저히 낮아지는 것으로 보고하였다. 본 연구에서도 점오염원으로부터 거리가 1~2 km만 멀어지더라도 농도 저감이 현저하였다. 반면, 축산마을 #1, 축산마을 #2는 대형 축사로부터 각각 약 2, 1 km 이격된 거리에 위치한다. 그럼에도 축산마을 #1에 소규모 축사가 존재하기 때문에 NH3 농도가 다소 높게 나타났다.
김제 농경지의 경우, 대기 중 NH3 평균 농도는 농경지 #1 37.5 ppb, 농경지 #2 31.4 ppb, 농경지 #3 35.5 ppb로 비슷한 수준이었고, 전체 평균 약 34.9 ppb였다. 이러한 수치는 양돈농가 부지경계인 축산마을 #3을 포함한 축사 밀집지역보다는 낮은 농도 수준이지만, 흥미롭게도 축산마을 #3을 제외하면 축산마을의 평균 농도보다 농경지에서 더 높은 농도를 보였다. 선행연구에서 토양의 수분함량은 비료에 포함된 NH3 휘발성에 중요한 영향을 미치는 것으로 보고하였다 (Al-Kanani et al., 1991; Clay and Malzer, 1990). 퇴비, 농약을 살포하였을 때, 토양 수분이 증가하게 되고 대기 중으로 휘산되는 NH3 양이 증가하는 것으로 나타났다 (Liu et al., 2017; Das et al., 2009; Mikkelsen, 2009; Han et al., 1997). 따라서, 화학비료, 농약 살포 등 농업활동의 영향으로 농경지에서 높은 수준의 NH3 농도를 보인 것으로 판단된다. 농경지에서는 여름철 뿐만 아니라 겨울철에도 평균 30 ppb가 넘는 고농도 NH3가 측정되었다. 본 김제 측정지점은 주변이 논밭으로 이루어져 있으며, 약 2 km 정도 떨어진 곳에 소규모 마을과 소규모의 축산농가 몇 채만이 존재하지만, 농경지에서 측정된 고농도 NH3가 소규모의 축산 농가에서 기인된 것으로 보기는 어렵다. Olivier et al. (1998)에서 농경지에서 발생하는 농업 잔재물 소각으로부터 NH3 배출이 상당한 것으로 보고하였다. 국내에서는 추수 이후 늦가을에서 겨울 동안 농업 잔재물 소각, 생활 쓰레기 소각 활동이 빈번하게 이루어진다 (Kim et al., 2016). 본 측정지점에서도 이러한 영향으로 겨울철 NH3 고농도 현상이 나타난 것으로 보여진다.
NH3 배출원이 적은 새만금 방조제의 평균 농도는 타 측정지점에 비해 매우 낮은 농도 수준인 약 4.9 ppb로 측정되었다. 온도가 낮아지는 겨울철 12월에는 그 농도 저하가 현저하며, 약 1.3 ppb로 나타났다. Sung et al. (2020)에서 2009~2018년 국가배경지역 측정소에서 측정한 제주도 고산의 NH3 평균 농도는 약 5 ppb로 보고되었으며 (표 2), 이는 새만금 방조제에서 2020년 6~12월에 측정된 NH3 농도와 유사한 수준이다.
4. 결 론
본 연구에서는 2020년 6~12월 동안 패시브 샘플러를 이용하여 전라북도 다양한 배출 환경에서 대기 중 NH3 농도 분포를 조사하였다. NH3 배출 특성을 고려하여 도심 (전주 3곳), 축산지역 (정읍 3곳), 농경지 (김제 3곳), 배출원이 비교적 적은 새만금 방조제 1곳 총 10개 지점에서 수행되었다. 전체 측정기간 동안 평균 NH3 농도는 축산마을 #3에서 약 161.1 ppb로 월등히 높은 수준을 보였고, 새만금 방조제에서 약 4.9 ppb로 가장 낮았다. 모든 측정지점에서 여름철 고농도 NH3가 발생하였으나, 예외적으로 축산마을 #3에서는 겨울철 활발한 퇴비 생산으로 인해 겨울철에 고농도 NH3가 발생하는 특징을 보였다.
NH3 배출 특성별 대기 중 농도는 축사밀집지역 (72.7±73.6 ppb)>농경지 밀집지역 (34.9±26.4 ppb) >도심지역 (13.0±6.2 ppb)>새만금 방조제 (4.9±1.8 ppb) 으로 나타났다. 대기 중 NH3는 축사밀집지역에서 월등히 높은 수준이었으며, 점오염원 (양돈농가)에서 1~2 km만 멀어지더라도 농도 감소가 현저하였다. 또한, 농경지에서 측정한 대기 중 NH3의 농도도 상당히 높은 수준으로 나타나 농업활동에 의한 NH3 영향도 상당한 것으로 보여진다.
NH3는 악취 물질이며, 대기 중에서 산성물질과 반응하여 미세먼지에 영향을 미치는 것으로 보고되고 있다. 그러나 국내에서는 현재까지 배출 특성에 따른 대기 중 NH3 연구결과는 부족한 실정이다. 본 연구결과는 국내 NH3 배출 특성과 저감대책 마련을 위한 기초자료로 활용될 수 있을 것이다.
Acknowledgments
본 연구는 2020년 국립환경과학원 (NIER-SP2020-279) 연구용역 및 농촌진흥청 연구사업 (PJ014931022021)의 지원으로 수행하였습니다.
References
-
Al-Kanani, T., MacKenzie, A.F., Barthakur, N.N. (1991) Soil water and ammonia volatilization relationships with surface-applied nitrogen fertilizer solutions, Soil Science Society of America Journal, 55(6), 1761-1766.
[https://doi.org/10.2136/sssaj1991.03615995005500060043x]

-
Bouwman, A.F., Lee, D.S., Asman, W.A.H., Dentener, F.J., Vander-Hoek, K.W., Olivier, J.G.J. (1997) A global high-resolution emission inventory for ammonia, Global Biogeochemical Cycles, 11, 561-8211.
[https://doi.org/10.1029/97GB02266]

-
Bytnerowicz, A., Fraczek, W., Schilling, S., Alexander, D. (2010) Spatial and temporal distribution of ambient nitric acid and ammonia in the Athabasca Oil Sands Region, Alberta, Journal of Limnology, 69, 11-21.
[https://doi.org/10.4081/jlimnol.2010.s1.11]

- Clean Air Policy Support System (CAPSS) (2019) 2017 Korea National Air Pollutants Emission. https://airemiss.nier.go.kr
-
Chang, Y., Zou, Z., Zhang, Y., Deng, C., Hu, J., Shi, Z., Dore, A.J., Collett, J.L. (2019) Assessing contributions of agricultural and nonagricultural emissions to atmospheric ammonia in a chinese megacity, Environmental Science and Technology, 53, 1822-1833.
[https://doi.org/10.1021/acs.est.8b05984]

-
Clay, D.E., Malzer, G.L., Anderson, J.L. (1990) Ammonia volatilization from urea as Influenced by soil temperature, soil water content, and nitrification and hydrolysis Inhibitors, Soil Science Society of America Journal, 54(1), 263-266.
[https://doi.org/10.2136/sssaj1990.03615995005400010042x]

-
Das, P., Sa, J.H., Kim, K.H., Jeon, E.C. (2009) Effect of fertilizer application on ammonia emission and concentration levels of ammonium, nitrate, and nitrite ions in a rice field, Environmental Monitoring and Assessment, 154, 275-282.
[https://doi.org/10.1007/s10661-008-0395-2]

-
Day, D.E., Chen, X., Gebhart, K.A., Carrico, C.M., Schwandner, F.M., Benedict, K.B., Schichtel, B.A., Collett, J.L. (2012) Spatial and temporal variability of ammonia and other inorganic aerosol species, Atmospheric Environment, 61, 490-498.
[https://doi.org/10.1016/j.atmosenv.2012.06.045]

-
Doyle, G.J., Tuazon, E.C., Graham, R.A., Mischke, T.M., Winer, A.M., Pitts, J.N. (1979) Simultaneous concentrations of ammonia and nitric acid in a polluted atmosphere and their equilibrium relationship to particulate ammonium nitrate, Environmental Science and Technology, 13, 1416-1419.
[https://doi.org/10.1021/es60159a010]

- Han, K., Cho, J., You, Y. (1997) Effect of diazinon application on ammonia volatilization in submerged incubation soil, Korean Society of Soil Sciences And Fertilizer, 30(4), 328-333
-
Huy, D.H., Thanh, L.T., Hien, T.H., Noro, K., Takenaka, N. (2017) Characteristic of ammonia gas and fine particulate ammonium from two distinct urban areas: Osaka, Japan, and Ho Chi Minh City, Vietnam, Environmental Science and Pollution Research, 24, 8147-8163.
[https://doi.org/10.1007/s11356-017-8496-5]

-
Jeong, D., Lee, Y., Lee, C., Choi, S., Kim, M., Lee, Y., Kim, M., Yu, S. (2014) Environmental impact of livestock manure and organic fertilizer use on the Masan stream watershed, Journal of Environmental Impact Assessment, 23(2), 75-87.
[https://doi.org/10.14249/eia.2014.23.2.75]

-
Kang, Y., Liu, M., Song, Y., Huang, X., Yao, H., Cai, X., Zhang, H., Kang, L., Liu, X., Yan, X., He, H., Zhang, Q., Shao, M., Zhu, T. (2016) High-resolution ammonia emissions inventories in China from 1980 to 2012, Atmospheric Chemistry and Physics, 16(4), 2043-2058.
[https://doi.org/10.5194/acp-16-2043-2016]

-
Kim, D.Y., Choi, M.-A., Han, Y.-H., Park, S.-K. (2016) A Study on Estimation of Air Pollutants Emission from Agricultural Waste Burning, Journal of Korean Society for Atmospheric Environment, 32, 167-175.
[https://doi.org/10.5572/KOSAE.2016.32.2.167]

-
Li, Y., Thompson, T.M., Van Damme, M., Chen, X., Benedict, K.B., Shao, Y., Day, D., Boris, A., Sullivan, A.P., Ham, J., Whitburn, S., Clarisse, L., Coheur, P.F., Collett, J.L. (2017) Temporal and spatial variability of ammonia in urban and agricultural regions of northern Colorado, United States, Atmospheric Chemistry and Physics, 17, 6197-6213.
[https://doi.org/10.5194/acp-17-6197-2017]

-
Liu, L., Zhang, X., Xu, W., Liu, X., Lu, X., Wang, S., Zhang, W., Zhao, L. (2017) Ground ammonia concentrations over China derived from satellite and atmospheric transport modeling, Remote Sensing, 9(5), 467.
[https://doi.org/10.3390/rs9050467]

-
López-Aizpún, M., Arango-Mora, C., Santamaría, C., Lasheras, E., Santamaría, J.M., Ciganda, V.S., Cárdenas, L.M., Elustondo, D. (2018) Atmospheric ammonia concentration modulates soil enzyme and microbial activity in an oak forest affecting soil microbial biomass, Soil Biology and Biochemistry, 116, 378-387.
[https://doi.org/10.1016/j.soilbio.2017.10.020]

-
Massman, W.J. (1998) A review of the molecular diffusivities of H2O, CO2, CH4, CO, O3, SO2, NH3, N2O, NO, and NO2 in air, O2 and N2 near STP, Atmospheric Environment, 32(6), 1111-1127.
[https://doi.org/10.1016/S1352-2310(97)00391-9]

-
Meng, Z., Xu, X., Lin, W., Ge, B., Xie, Y., Song, B., Jia, S., Zhang, R., Peng, W., Wang, Y., Cheng, H., Yang, W., Zhao, H. (2018) Role of ambient ammonia in particulate ammonium formation at a rural site in the North China Plain, Atmospheric Chemistry and Physics, 18, 167-184.
[https://doi.org/10.5194/acp-18-167-2018]

- Mikkelsen, R. (2009) Ammonia emissions from agricultural operations: Fertilizer. Better Crops, 4(93), 9. NH3 Passive sampler Manual, RAD168, Radiello, USA. https://www.radiello.com
-
Olivier, J.G.J., Bouwman, A.F., Van Der Hoek, K.W., Berdowski, J. J.M. (1998) Global air emission inventories for anthropogenic sources of NO(x), NH3 and N2O in 1990, Environmental Pollution, 102, 135-148.
[https://doi.org/10.1016/S0269-7491(98)80026-2]

-
Pan, Y., Tian, S., Zhao, Y., Zhang, L., Zhu, X., Gao, J., Huang, W., Zhou, Y., Song, Y., Zhang, Q., Wang, Y. (2018) Identifying Ammonia Hotspots in China Using a National Observation Network [Research-article], Environmental Science and Technology, 52(7), 3926-3934.
[https://doi.org/10.1021/acs.est.7b05235]

-
Park, J., Ryoo, J., Jee, J., Song, M. (2020) Origins and Distributions of Atmospheric Ammonia in Jeonju during 2019~2020, Journal of Korean Society for Atmospheric Environment, 36(2), 262-274.
[https://doi.org/10.5572/KOSAE.2020.36.2.262]

-
Perrino, C., Catrambone, M. (2004) Development of a variable-path-length diffusive sampler for ammonia and evaluation of ammonia pollution in the urban area of Rome, Italy, Atmospheric Environment, 38, 6667-6672.
[https://doi.org/10.1016/j.atmosenv.2004.08.032]

-
Pienaar, J.J., Beukes, J.P., Van Zyl, P.G., Lehmann, C.M.B., Aherne, J. (2015) Passive Diffusion Sampling Devices for Monitoring Ambient Air Concentrations, Comprehensive Analytical Chemistry, 70, 13-52.
[https://doi.org/10.1016/bs.coac.2015.09.002]

-
Pu, W., Ma, Z., Collett, J.L., Guo, H., Lin, W., Cheng, Y., Quan, W., Li, Y., Dong, F., He, D. (2020) Regional transport and urban emissions are important ammonia contributors in Beijing, China. Environmental Pollution, 265, 115062.
[https://doi.org/10.1016/j.envpol.2020.115062]

-
Puchalski, M.A., Sather, M.E., Walker, J.T., Lehmann, C.M.B., Gay, D.A., Mathew, J., Robarge, W.P. (2011) Passive ammonia monitoring in the United States: Comparing three different sampling devices, Journal of Environmental Monitoring, 13, 3156-3167.
[https://doi.org/10.1039/c1em10553a]

-
Roadman, M.J., Scudlark, J.R., Meisinger, J.J., Ullman, W.J. (2003) Validation of Ogawa passive samplers for the determination of gaseous ammonia concentrations in agricultural settings, Atmospheric Environment, 37, 2317-2325.
[https://doi.org/10.1016/S1352-2310(03)00163-8]

-
Sharma, S.K., Datta, A., Saud, T., Saxena, M., Mandal, T.K., Ahammed, Y.N., Arya, B.C. (2010) Seasonal variability of ambient NH3, NO, NO2 and SO2 over Delhi, Journal of Environmental Sciences, 22, 1023-1028.
[https://doi.org/10.1016/S1001-0742(09)60213-8]

-
Song, M., Kim, M., Kim, M., Lee, K.H., Bae, M.S. (2020) Relationship between Long-range Transport of Ammonia and Ammonium in Wintertime in Suburban Area, Journal of Korean Society for Atmospheric Environment, 36, 543-557.
[https://doi.org/10.5572/KOSAE.2020.36.4.543]

- Statistics Korea (KOSTAT) (2020) Korean Statistical Information Service, http://kosis.kr, (accessed 03.02.2020).
-
Stelson, A.W., Seinfeld, J.H. (1982) Thermodynamic prediction of the water activity, NH4NO3 dissociation constant, density and refractive index for the NH4NO3-(NH4)2 SO4-H2O system at 25°C, Atmospheric Environment (1967), 16(10), 2507-2514.
[https://doi.org/10.1016/0004-6981(82)90142-1]

-
Streets, D.G., Bond, T.C., Carmichael, G.R., Fernandes, S.D., Fu, Q., He, D., Klimont, Z., Nelson, S.M., Tsai, N.Y., Wang, M.Q., Woo, J.-H., Yarber, K.F. (2003) An inventory of gaseous and primary aerosol emissions in Asia in the year 2000, Journal of Geophysical Research, 108 (21), 8809.
[https://doi.org/10.1029/2002JD003093]

-
Sung, M.Y., Park, J.S., Lim, J.H., Park, H.Y., Cho, S.Y. (2020) A long term trend of gaseous and particulate acid/base species and effects of ammonia reduction on nitrate contained in PM2.5, 2009~2018, Journal of Korean Society for Atmospheric Environment, 36(2), 249-261.
[https://doi.org/10.5572/KOSAE.2020.36.2.249]

-
Theobald, M.R., Sanz-Cobena, A., Vallejo, A., Sutton, M.A. (2015) Suitability and uncertainty of two models for the simulation of ammonia dispersion from a pig farm located in an area with frequent calm conditions, Atmospheric Environment, 102, 167-175.
[https://doi.org/10.1016/j.atmosenv.2014.11.056]

-
Wang, S., Nan, J., Shi, C., Fu, Q., Gao, S., Wang, D., Cui, H., Saiz-Lopez, A., Zhou, B. (2015) Atmospheric ammonia and its impacts on regional air quality over the megacity of Shanghai, China, Scientific Reports, 5, 15842.
[https://doi.org/10.1038/srep15842]

-
Xu, W., Wu, Q., Liu, X., Tang, A., Dore, A.J., Heal, M.R. (2016) Characteristics of ammonia, acid gases, and PM2.5 for three typical land-use types in the North China Plain, Environmental Science and Pollution Research, 23, 1158-1172.
[https://doi.org/10.1007/s11356-015-5648-3]

-
Xu, W., Zheng, K., Liu, X., Meng, L., Huaitalla, R.M., Shen, J., Hartung, E., Gallmann, E., Roelcke, M., Zhang, F. (2014) Atmospheric NH3 dynamics at a typical pig farm in China and their implications, Atmospheric Pollution Research, 5, 455-463.
[https://doi.org/10.5094/APR.2014.053]

-
Xu, Z., Liu, M., Zhang, M., Song, Y., Wang, S., Zhang, L., Xu, T., Wang, T., Yan, C., Zhou, T., Sun, Y., Pan, Y., Hu, M., Zheng, M., Zhu, T. (2019) High efficiency of livestock ammonia emission controls in alleviating particulate nitrate during a severe winter haze episode in northern China, Atmospheric Chemistry and Physics, 19, 5605-5613.
[https://doi.org/10.5194/acp-19-5605-2019]

-
Zhao, D.W., Wang, A.P. (1994) Estimation of anthropogenic ammonia emissions in Asia, Atmospheric Environment, 28(4), 689-694.
[https://doi.org/10.1016/1352-2310(94)90045-0]

박준수 (전북대학교 환경에너지융합학과 석사과정)
오상민 (전북대학교 환경에너지융합학과 석사과정)
배민석 (목포대학교 환경공학과 교수)
임용재 (국립환경과학원 기후대기연구부 대기환경연구과 연구사)
장유운 (국립환경과학원 기후대기연구부 대기환경연구과 전문연구원)
송미정 (전북대학교 지구환경과학과 교수)

